Free Access
Fig. 3
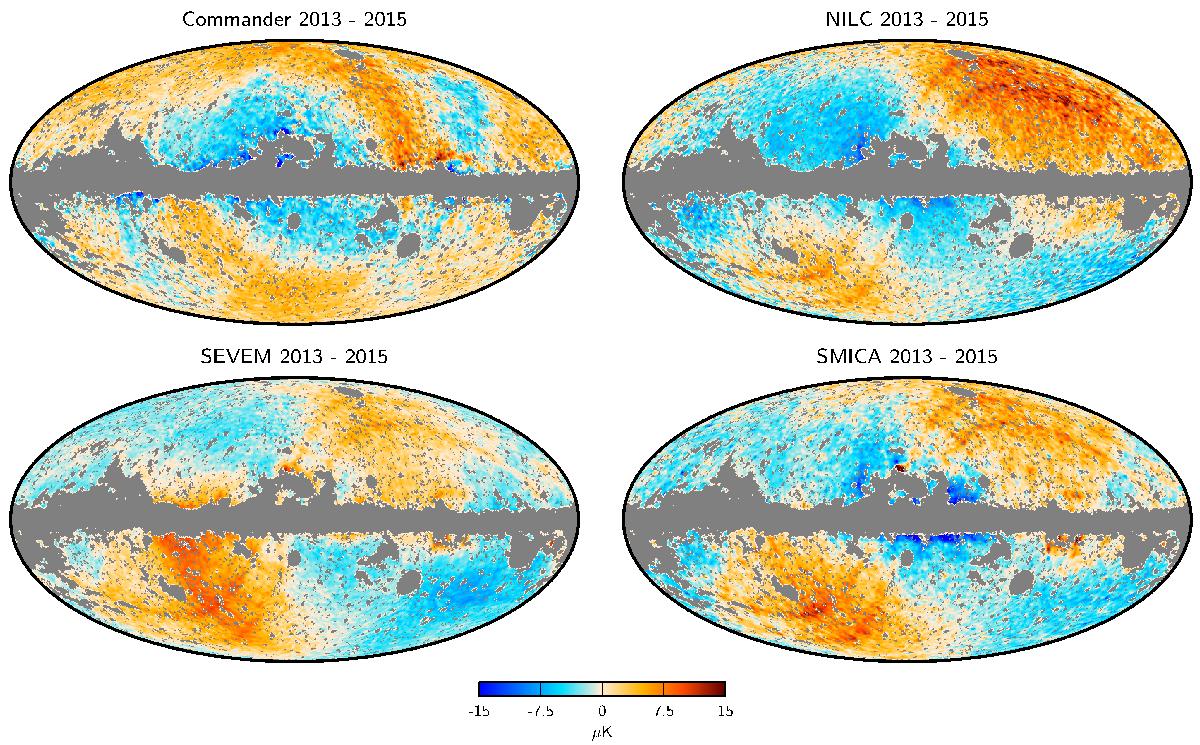
Differences between the component-separated CMB temperature maps from the 2013 and the 2015 releases. The maps have been smoothed to FWHM 80′ and downgraded to Nside = 128.
This figure is made of several images, please see below:

Current usage metrics show cumulative count of Article Views (full-text article views including HTML views, PDF and ePub downloads, according to the available data) and Abstracts Views on Vision4Press platform.
Data correspond to usage on the plateform after 2015. The current usage metrics is available 48-96 hours after online publication and is updated daily on week days.
Initial download of the metrics may take a while.