Fig. D.1
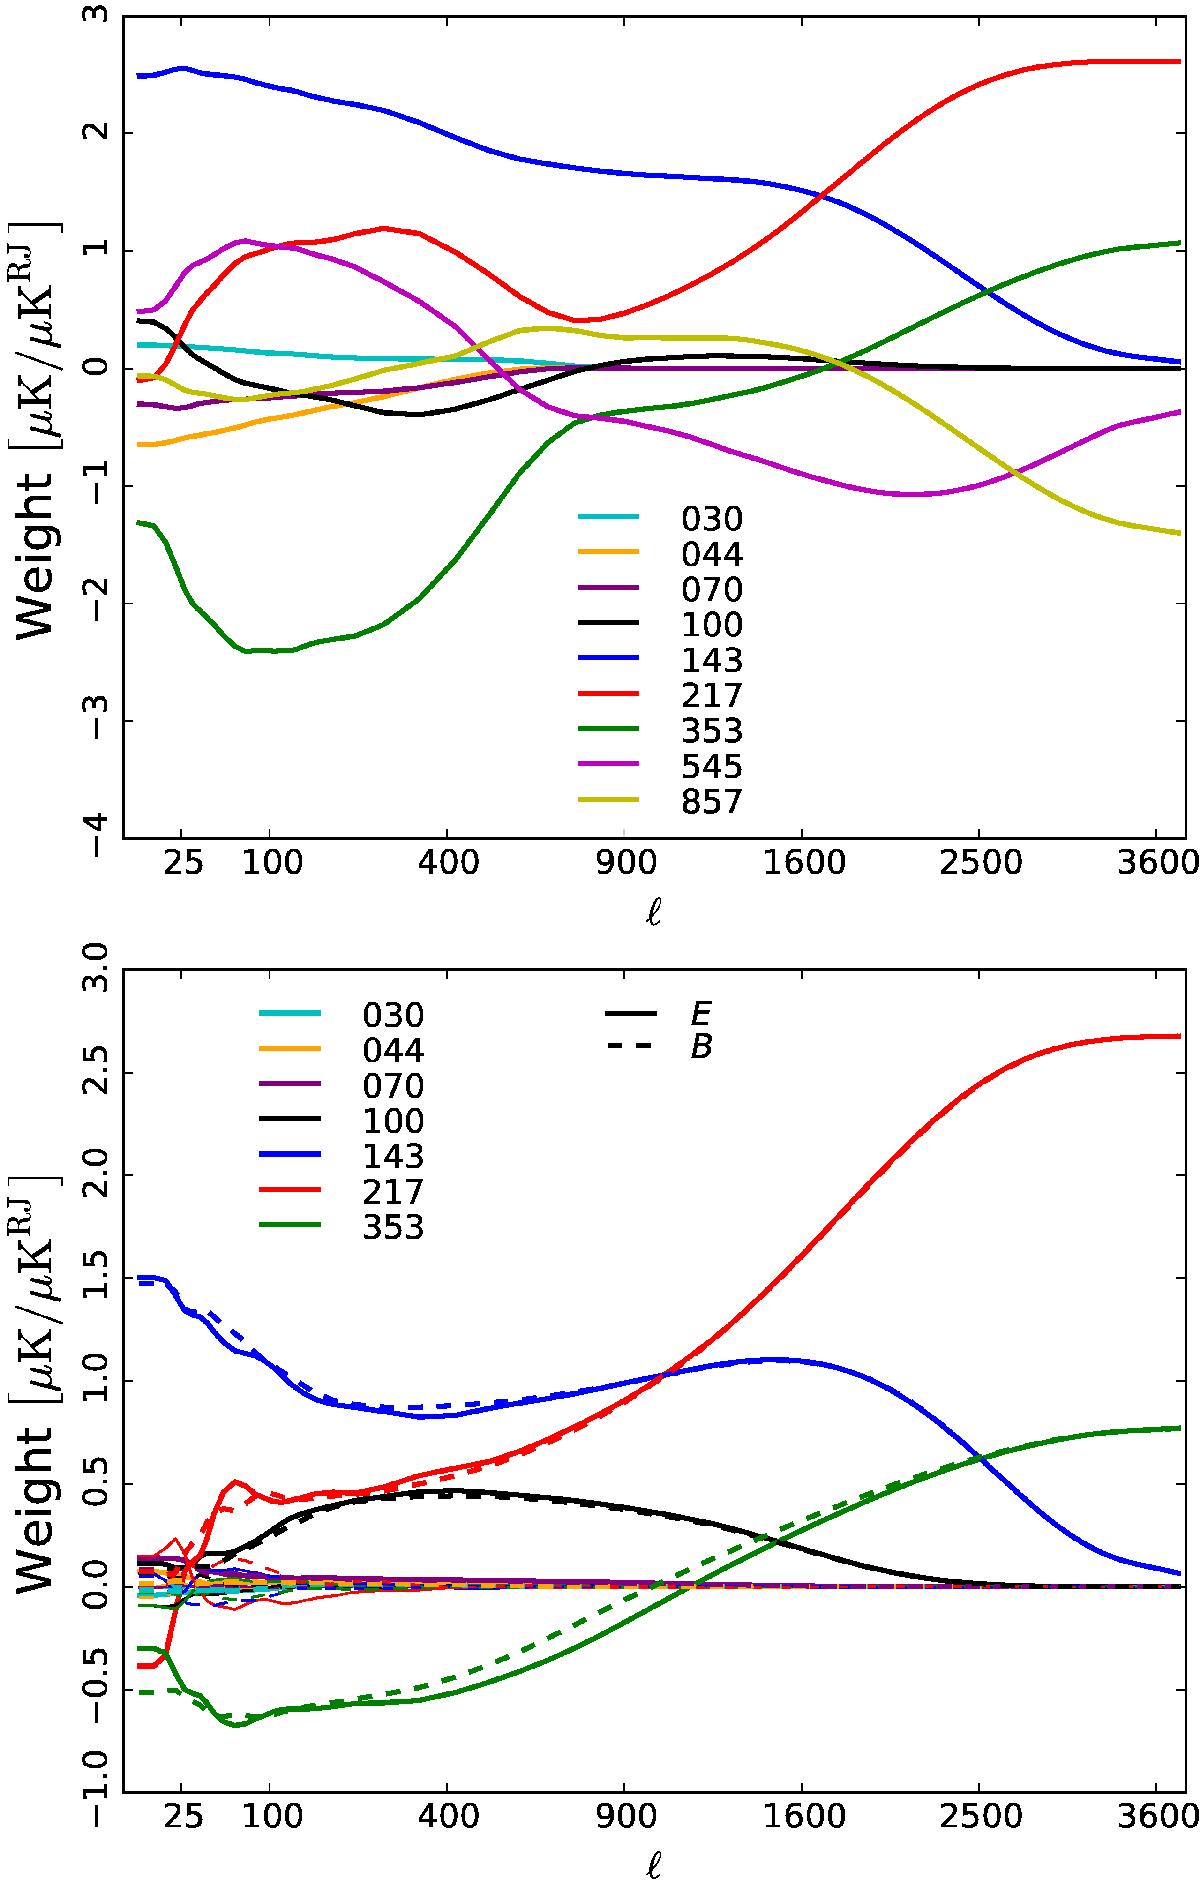
SMICA weights for temperature (top) and polarization (bottom). For readability, the values are shown for input maps in units of antenna temperature. The plot goes up to ℓ ≃ 3600, but the output maps are synthesized using all multipoles up to ℓ = 4000. For polarization, the thick solid lines show the contribution of input E-modes to the CMB E-modes and the thick dashed lines show the same for the B-modes. The thin lines, all close to zero, show “cross-contributions” of input E-modes to the CMB B-modes and vice versa.
Current usage metrics show cumulative count of Article Views (full-text article views including HTML views, PDF and ePub downloads, according to the available data) and Abstracts Views on Vision4Press platform.
Data correspond to usage on the plateform after 2015. The current usage metrics is available 48-96 hours after online publication and is updated daily on week days.
Initial download of the metrics may take a while.