Fig. 16
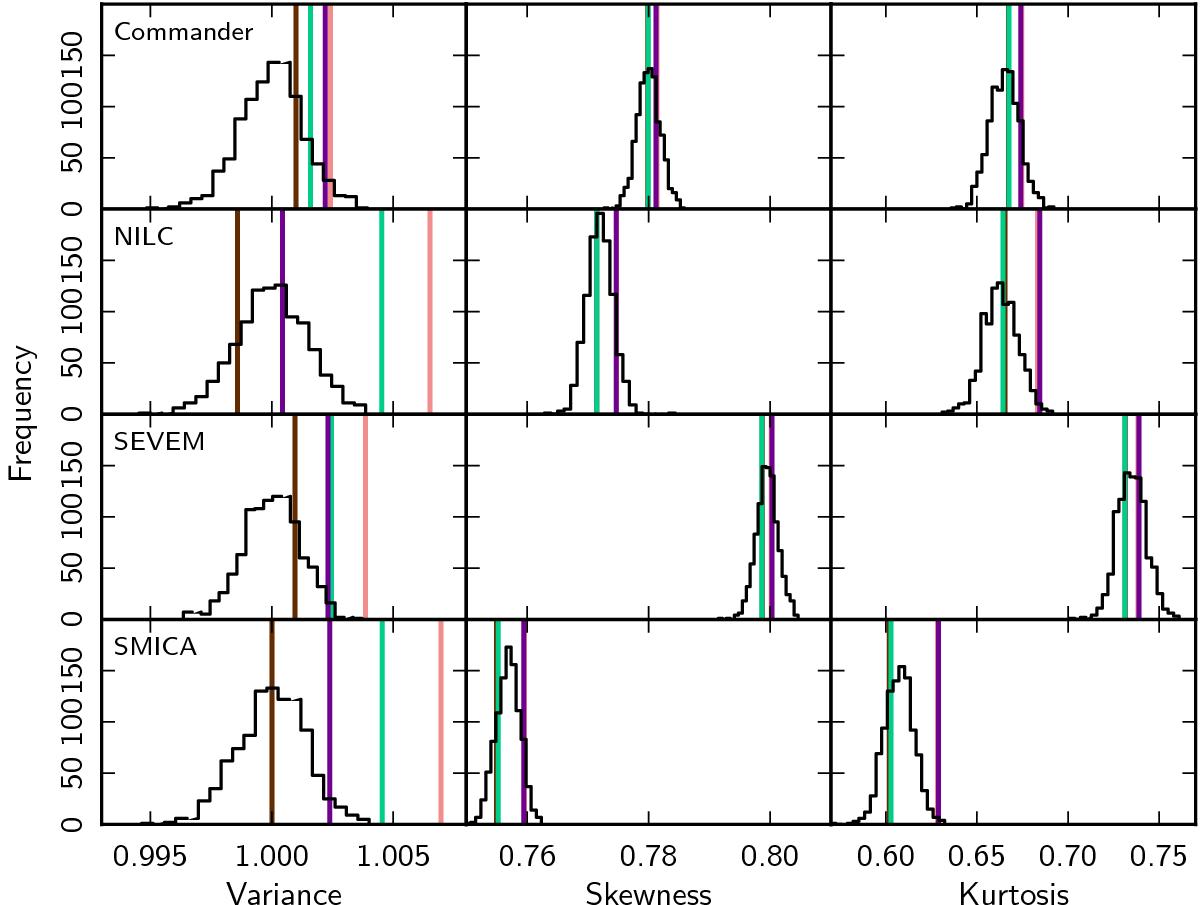
Polarized intensity variance (left column), skewness (middle column), and kurtosis (right column) evaluated from the FFP8 Monte Carlo simulations (histogram) and from components of the fiducial FFP8 map at Nside = 1024 outside the FFP8-UPA76 mask. The variance distributions have been normalized to the mean value of the Monte Carlo distributions for visualization purposes. Coloured vertical lines correspond to different combinations of components: the sum of CMB and noise is shown in brown; the sum of CMB, noise, and thermal dust is shown in light teal; the sum of CMB, noise, and radio point sources is shown in violet; the sum of CMB, noise, and all foregrounds is shown in pink.
Current usage metrics show cumulative count of Article Views (full-text article views including HTML views, PDF and ePub downloads, according to the available data) and Abstracts Views on Vision4Press platform.
Data correspond to usage on the plateform after 2015. The current usage metrics is available 48-96 hours after online publication and is updated daily on week days.
Initial download of the metrics may take a while.