Fig. 14
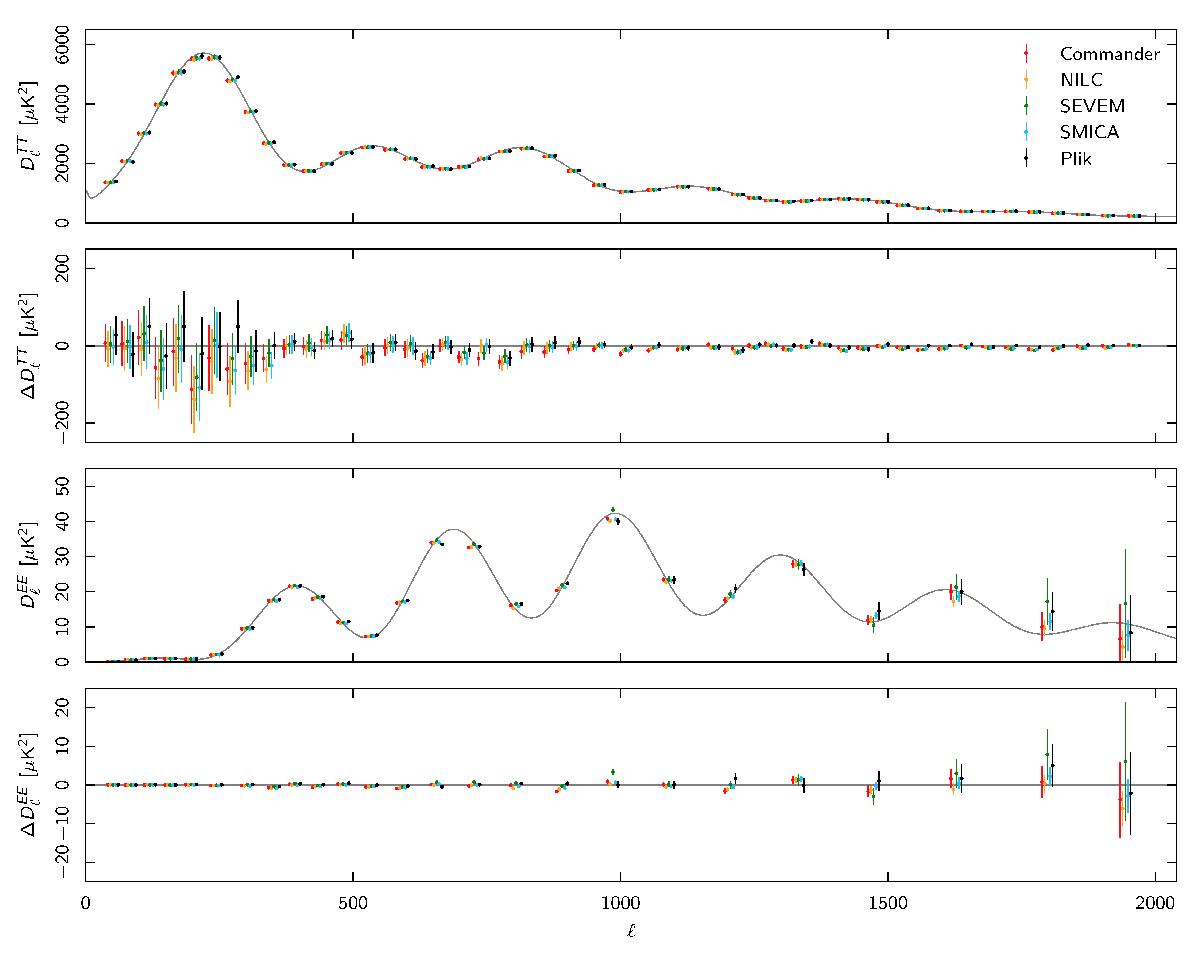
CMB TT and EE power spectra for each of the four foreground-cleaned maps. The first panel shows the TT bandpowers after subtracting the best-fit model of residual extragalactic foregrounds. The black points show the frequency-map based Plik spectrum, and the grey line shows the best-fit ΛCDM model from the Planck 2015 likelihood. The second panel shows the residuals of the TT bandpowers after subtracting the best-fit ΛCDM model. The third and fourth panels show the same information for the EE spectra. The bands are the same for all methods, but the points are offset horizontally for clarity. The parameters of the foreground model are marginalized over when estimating parameters (see Fig. 15).
Current usage metrics show cumulative count of Article Views (full-text article views including HTML views, PDF and ePub downloads, according to the available data) and Abstracts Views on Vision4Press platform.
Data correspond to usage on the plateform after 2015. The current usage metrics is available 48-96 hours after online publication and is updated daily on week days.
Initial download of the metrics may take a while.