Fig. 27
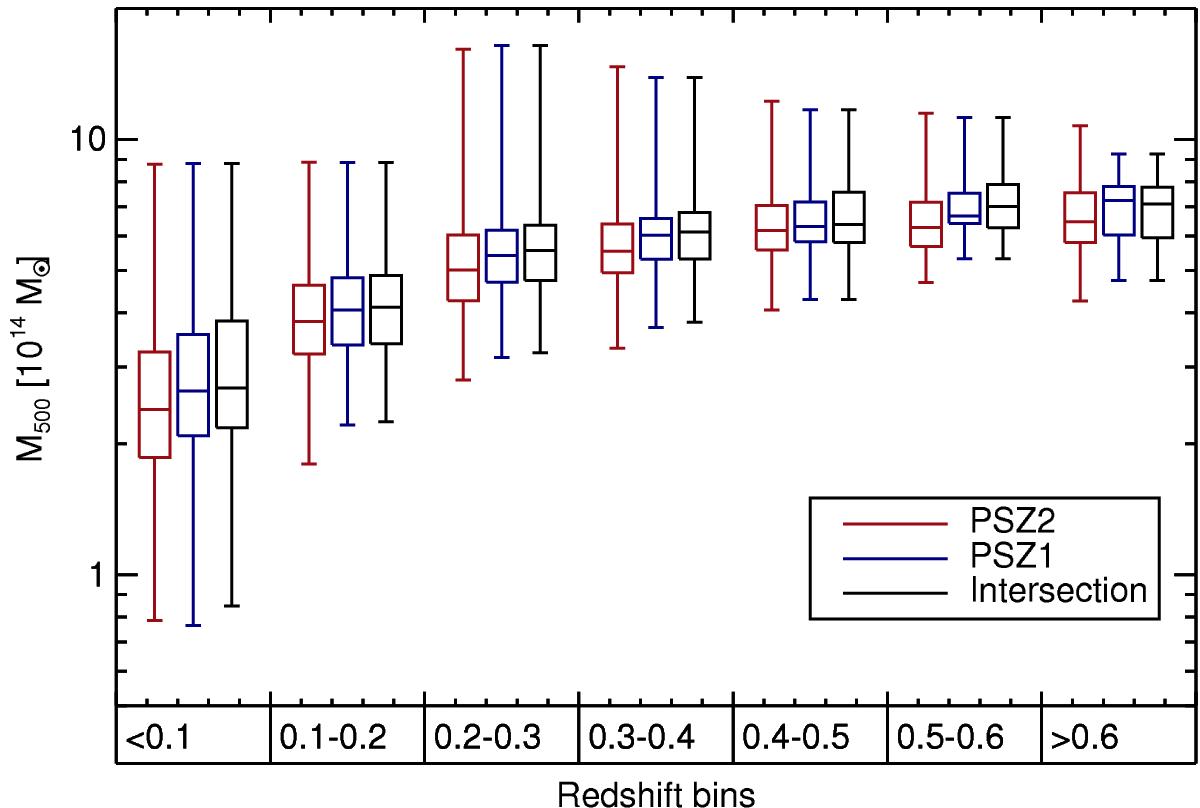
Box-and-whisker diagrams showing the mass distribution of the PSZ2 (red), PSZ1 (blue) and their intersection (black) sample in seven redshift bins. The bottom and the top of the boxes represent the first and third quartileof the data, while the band inside the box shows the median (i.e., the second quartile). The ends of the whiskers mark the minimum and maximum of the data.
Current usage metrics show cumulative count of Article Views (full-text article views including HTML views, PDF and ePub downloads, according to the available data) and Abstracts Views on Vision4Press platform.
Data correspond to usage on the plateform after 2015. The current usage metrics is available 48-96 hours after online publication and is updated daily on week days.
Initial download of the metrics may take a while.