Free Access
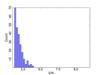
Fig. 19
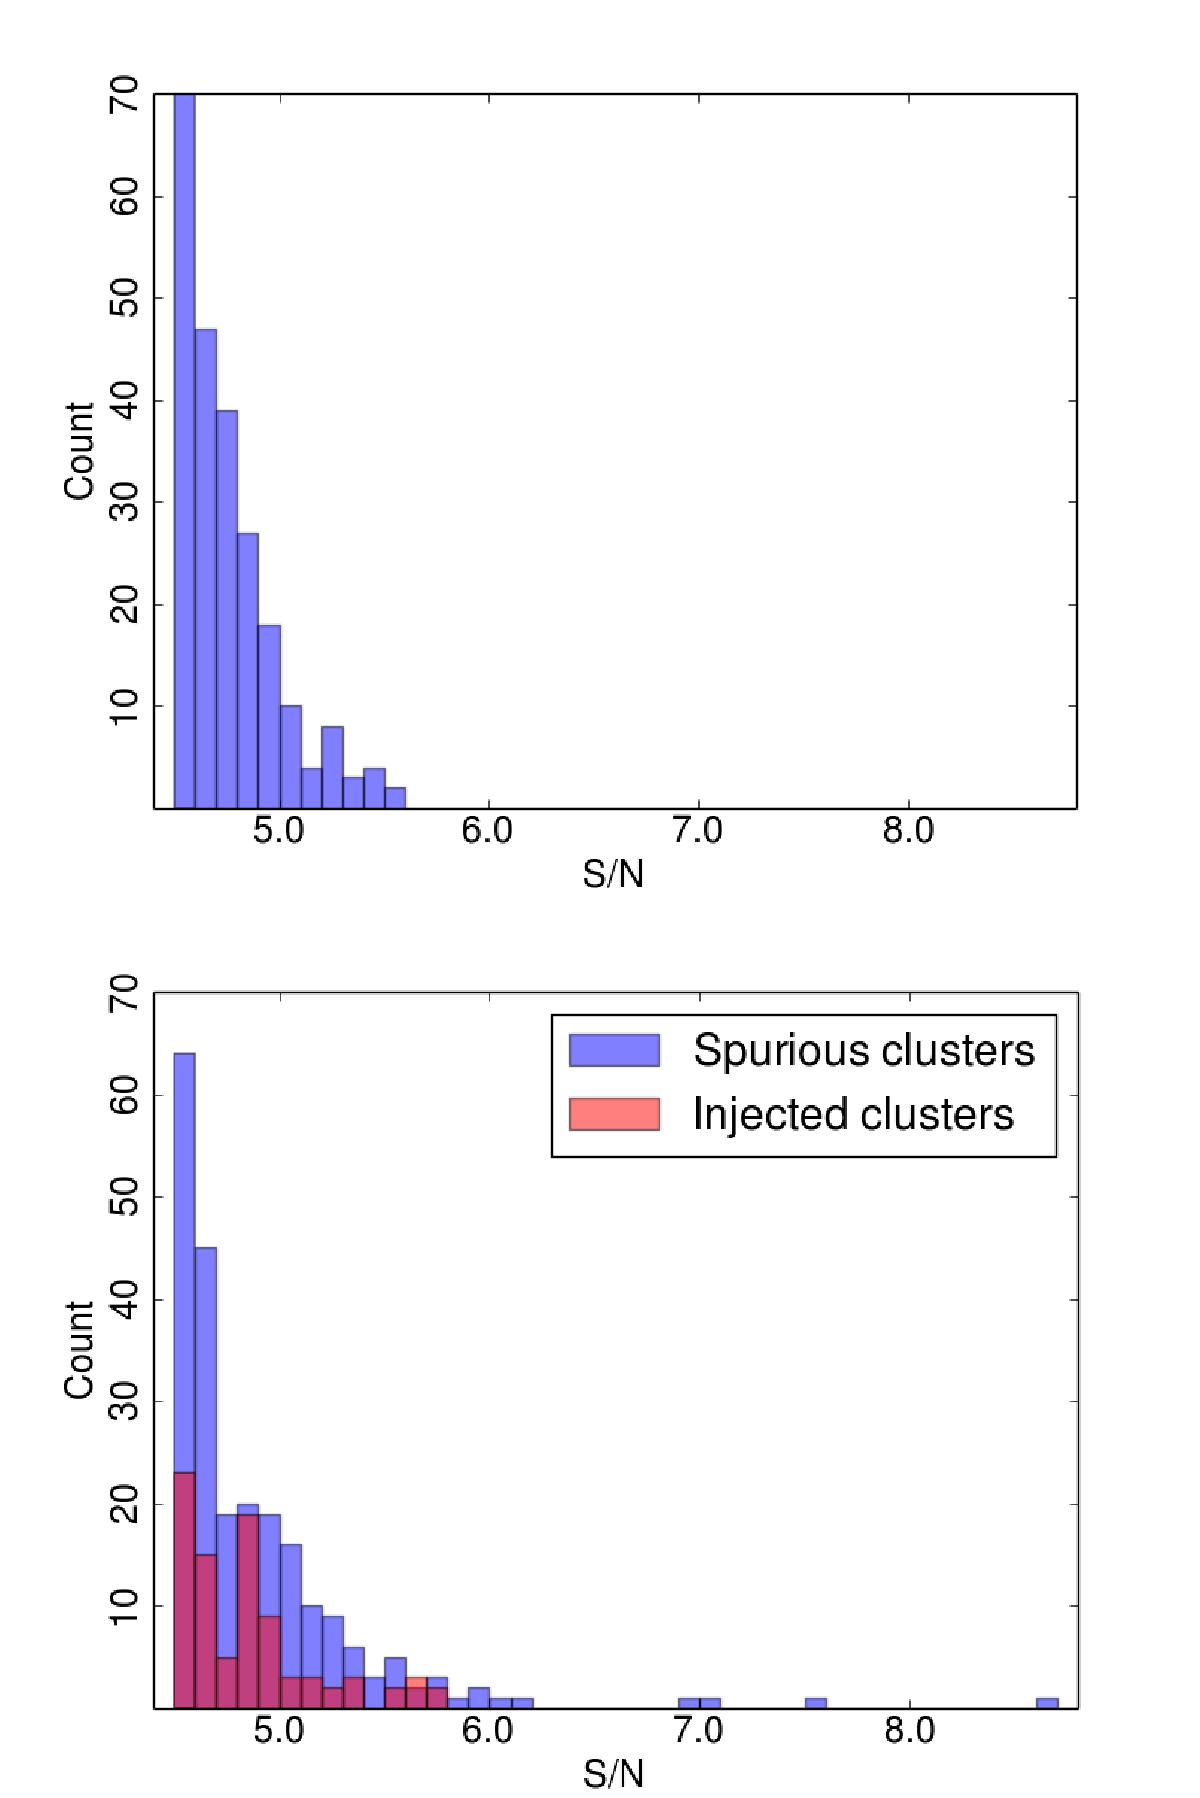
Distribution of S/N for missing nominal mission detections, lost due to downward fluctuation of the S/N rather than because of spurious rejection cuts or changes in the survey mask. Top: detections lost from the PSZ1. Bottom: detections lost in simulations of the transition from the nominal to full mission.
This figure is made of several images, please see below:
Current usage metrics show cumulative count of Article Views (full-text article views including HTML views, PDF and ePub downloads, according to the available data) and Abstracts Views on Vision4Press platform.
Data correspond to usage on the plateform after 2015. The current usage metrics is available 48-96 hours after online publication and is updated daily on week days.
Initial download of the metrics may take a while.