Fig. 9
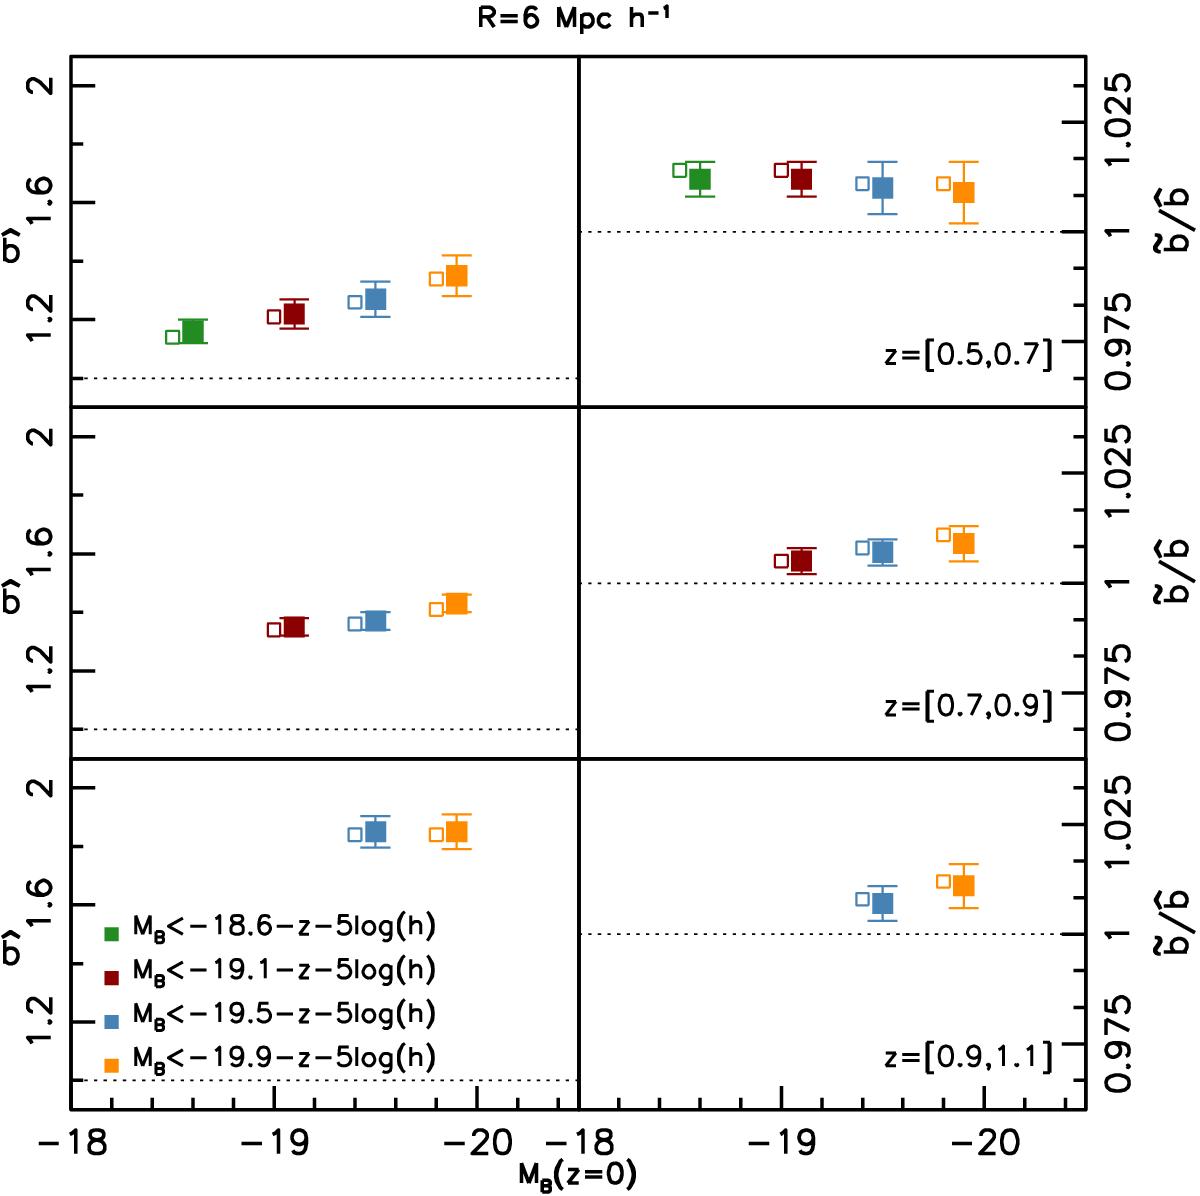
Second-order moments of the mean biasing functions shown in Fig. 7. Left panels: moment ![]() . Right panels: non-linear parameter
. Right panels: non-linear parameter ![]() . The cell size is R = 6h-1 Mpc . Error bars indicate 1σ scatter from the mocks. The redshift ranges and colour code are the same as in Fig. 7. Magnitude cuts are indicated in the plots. All values were computed assuming σ8 = 0.9. The horizontal dashed line is plotted for reference and represents the case of no bias (left plot) and linear bias (right panels). Large filled symbols refer to measurements performed at δMAX, and small, open symbols refer to estimates at
. The cell size is R = 6h-1 Mpc . Error bars indicate 1σ scatter from the mocks. The redshift ranges and colour code are the same as in Fig. 7. Magnitude cuts are indicated in the plots. All values were computed assuming σ8 = 0.9. The horizontal dashed line is plotted for reference and represents the case of no bias (left plot) and linear bias (right panels). Large filled symbols refer to measurements performed at δMAX, and small, open symbols refer to estimates at ![]() .
.
Current usage metrics show cumulative count of Article Views (full-text article views including HTML views, PDF and ePub downloads, according to the available data) and Abstracts Views on Vision4Press platform.
Data correspond to usage on the plateform after 2015. The current usage metrics is available 48-96 hours after online publication and is updated daily on week days.
Initial download of the metrics may take a while.