Fig. 8
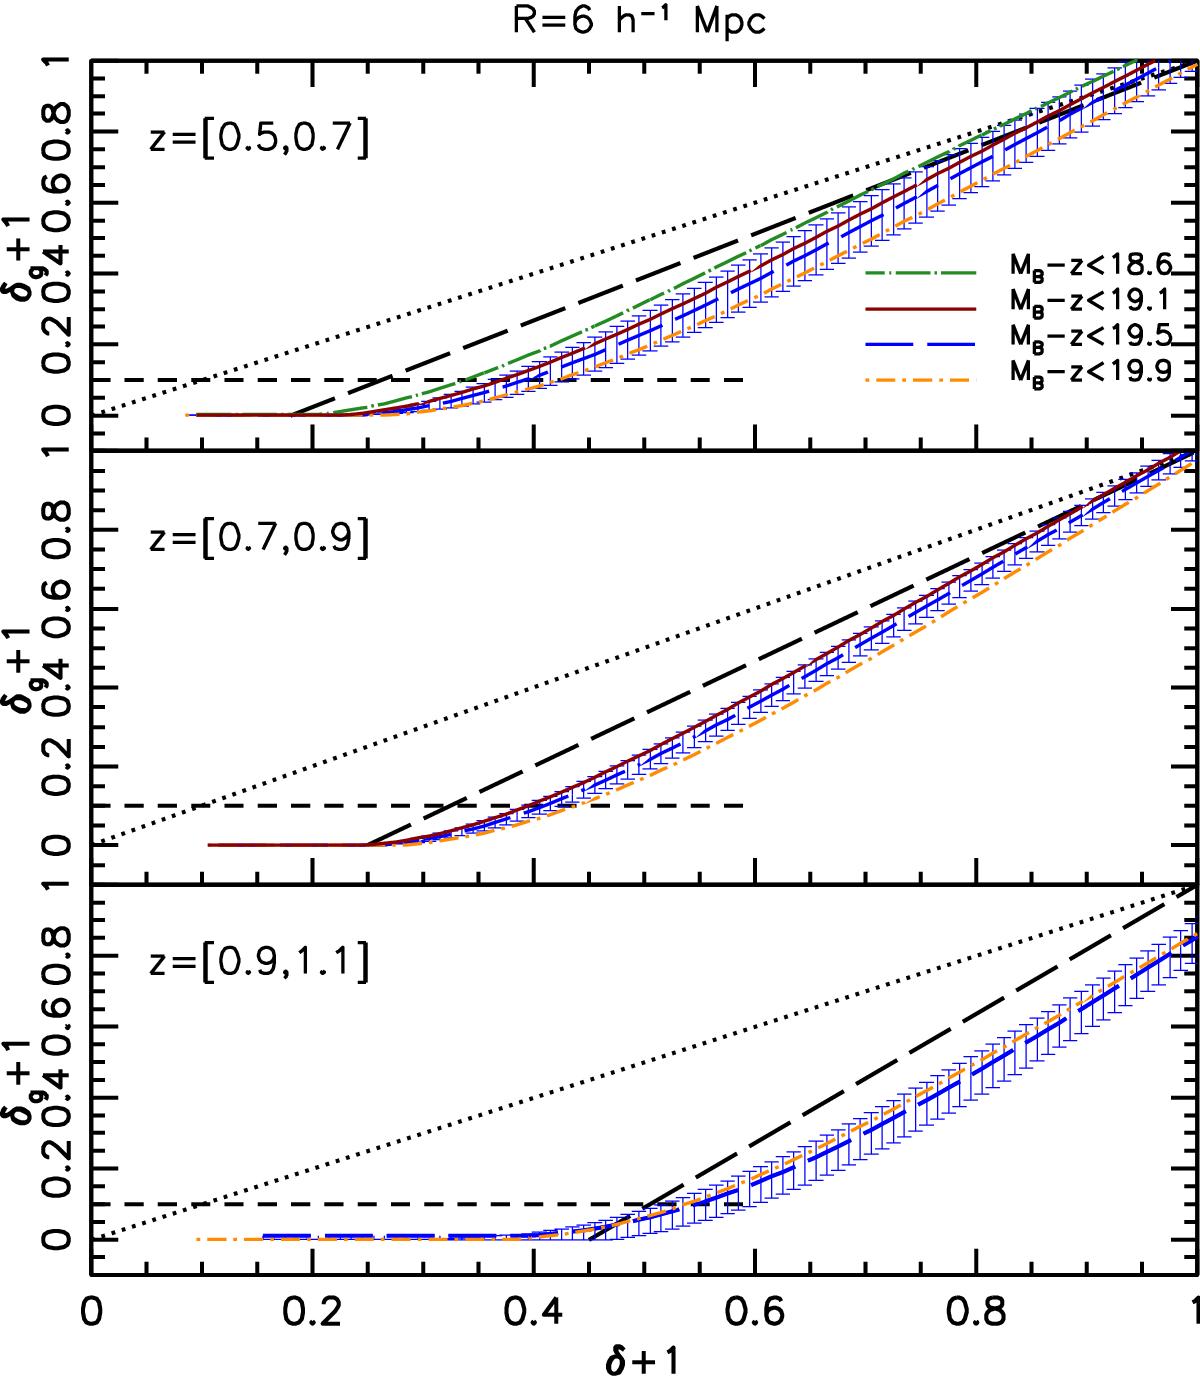
Zoom into the under-density range of Fig. 7. The horizontal short-dashed line represents the over-density threshold δg = −0.9. The long dashed line shows the linear biasing function ![]() , for the
, for the ![]() value corresponding to the MB − z − 5log (h) < 19.5 cut, which is listed in Table 2. The dotted line, shown for reference, shows the case bLIN = 1. Error bars represent the 1σ rms scatter among the mocks. They are only shown for the case MB − z − 5log (h) < 19.5 to avoid overcrowding.
value corresponding to the MB − z − 5log (h) < 19.5 cut, which is listed in Table 2. The dotted line, shown for reference, shows the case bLIN = 1. Error bars represent the 1σ rms scatter among the mocks. They are only shown for the case MB − z − 5log (h) < 19.5 to avoid overcrowding.
Current usage metrics show cumulative count of Article Views (full-text article views including HTML views, PDF and ePub downloads, according to the available data) and Abstracts Views on Vision4Press platform.
Data correspond to usage on the plateform after 2015. The current usage metrics is available 48-96 hours after online publication and is updated daily on week days.
Initial download of the metrics may take a while.