Fig. 7
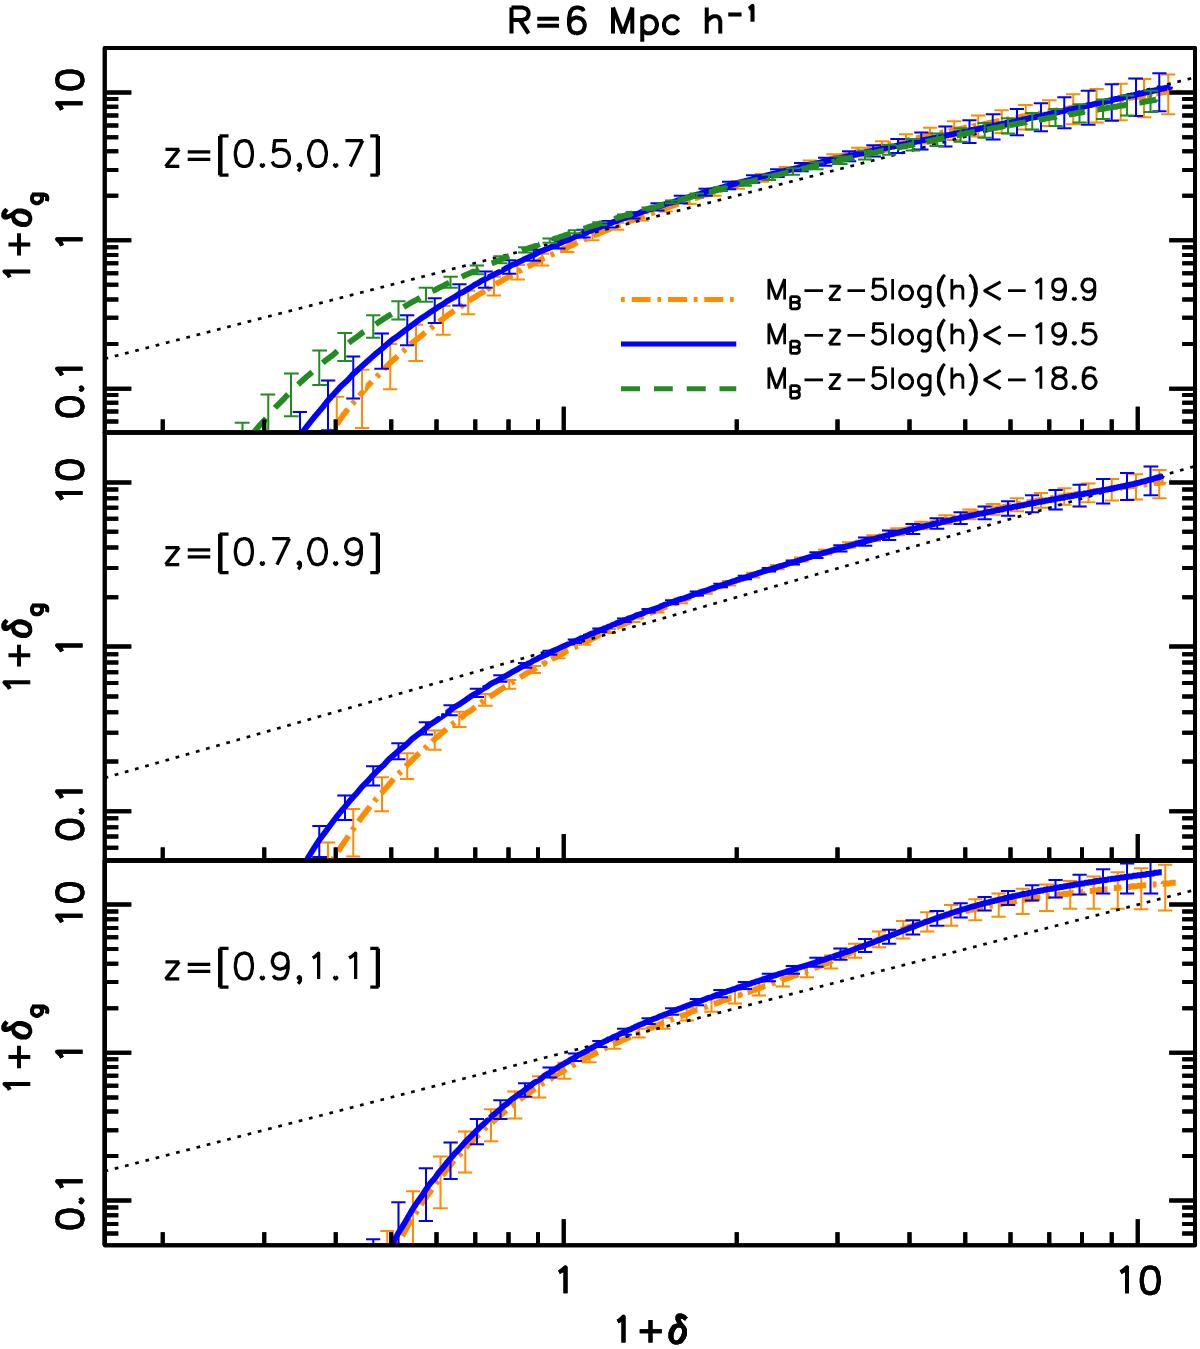
Mean biasing function of VIPERS galaxies from counts in cells of radius 6 h-1 Mpc as a function of the B-band magnitude cut in three redshift ranges indicated in each panel. Curves with different colours and line styles correspond to the different magnitude cuts indicated in upper panel. Error bars with matching colours represent the associated 1σ uncertainty intervals estimated from the mocks. A horizontal offset δ = 0.015 was applied to avoid overlapping error bars. All biasing functions are plotted out to δMAX.
Current usage metrics show cumulative count of Article Views (full-text article views including HTML views, PDF and ePub downloads, according to the available data) and Abstracts Views on Vision4Press platform.
Data correspond to usage on the plateform after 2015. The current usage metrics is available 48-96 hours after online publication and is updated daily on week days.
Initial download of the metrics may take a while.