Fig. 6
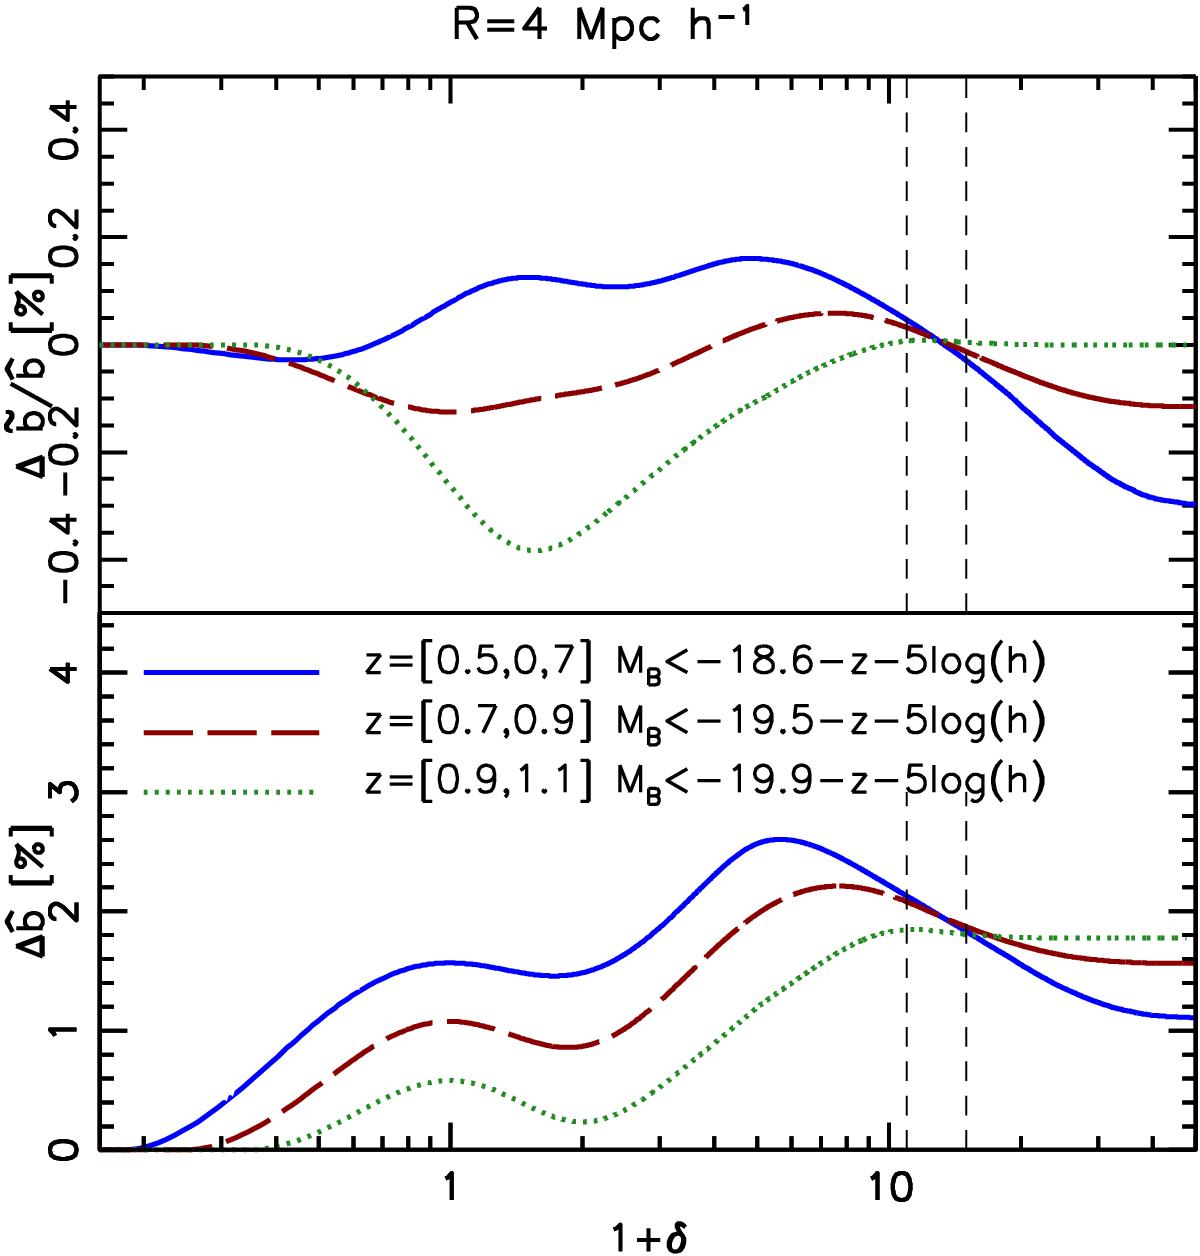
Bottom panel: per cent difference between the ![]() values estimated in redshift space and in real space using spherical cells with a radius of 4 h-1 Mpc as a function of 1 + δMAX (see Eq. (7)). The different curves refer to different redshift shells and magnitude cuts, as indicated in the plot. Upper panel: per cent difference in the estimated non-linear parameter
values estimated in redshift space and in real space using spherical cells with a radius of 4 h-1 Mpc as a function of 1 + δMAX (see Eq. (7)). The different curves refer to different redshift shells and magnitude cuts, as indicated in the plot. Upper panel: per cent difference in the estimated non-linear parameter ![]() . Vertical dashed lines are drawn in correspondence to the δMAX values at which systematic errors are computed and listed in Table 2.
. Vertical dashed lines are drawn in correspondence to the δMAX values at which systematic errors are computed and listed in Table 2.
Current usage metrics show cumulative count of Article Views (full-text article views including HTML views, PDF and ePub downloads, according to the available data) and Abstracts Views on Vision4Press platform.
Data correspond to usage on the plateform after 2015. The current usage metrics is available 48-96 hours after online publication and is updated daily on week days.
Initial download of the metrics may take a while.