Fig. 5
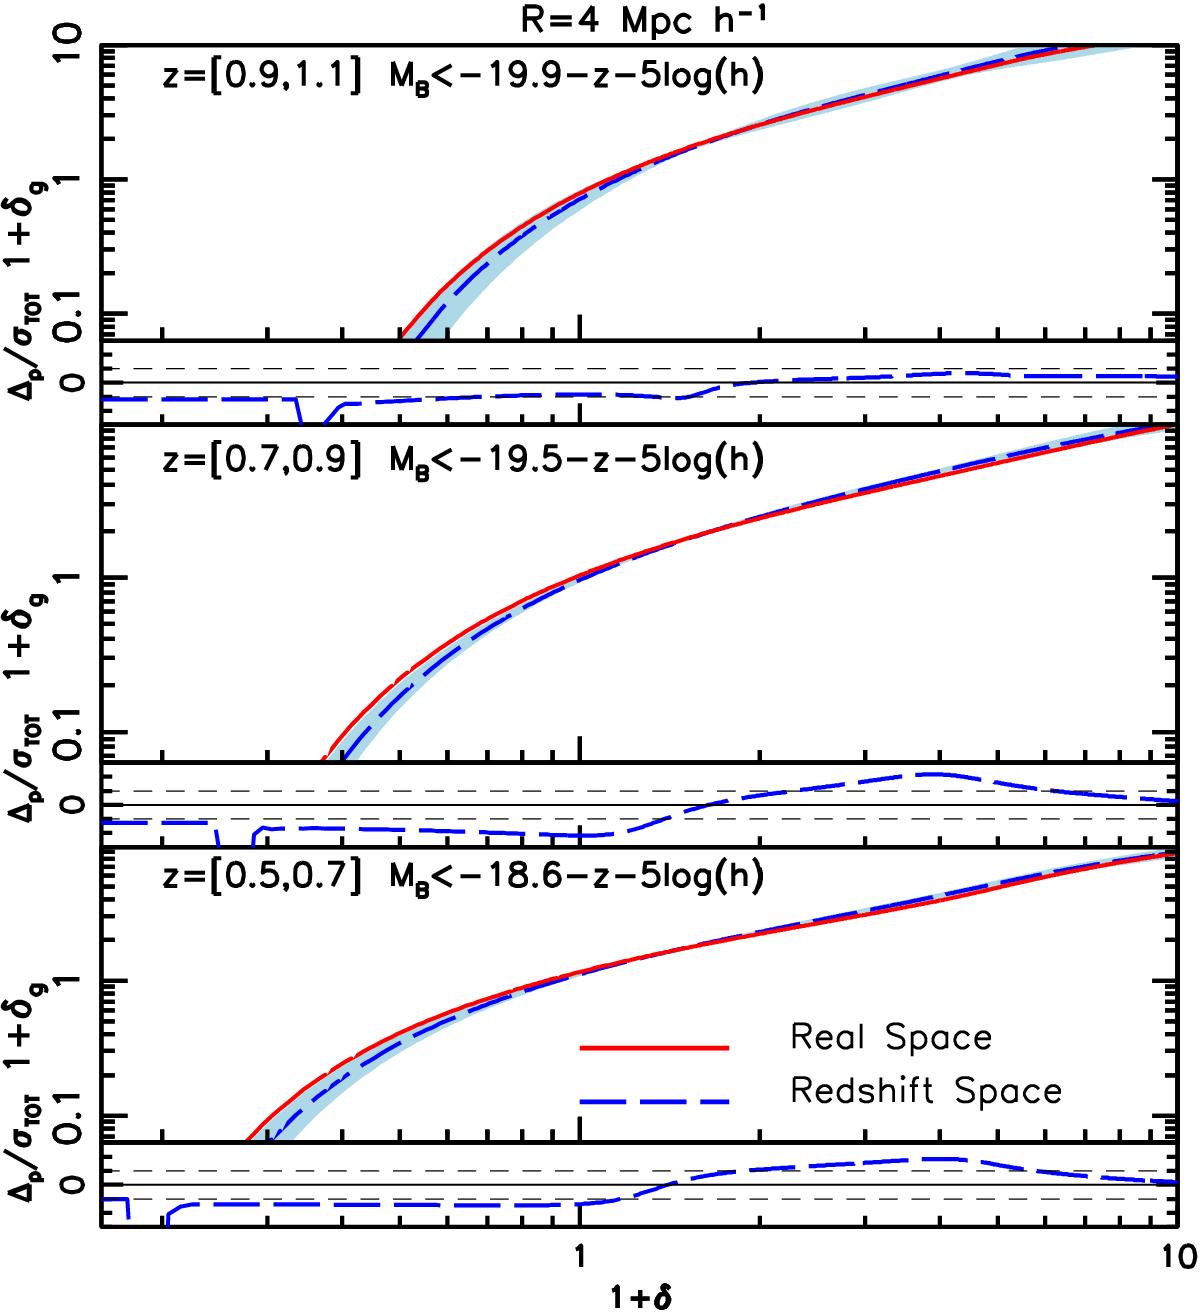
Mean biasing function estimated in real space (solid, red curve) and redshift space (dashed blue curve and its 2σ uncertainty band). Counts are performed in spherical cells with a radius of 4 h-1 Mpc . The luminosity cut and the redshift range is indicated in each panel. The width of each band represents the scatter among mocks. In the bottom part of each plot we show the difference Δp between the reconstructed and reference PDFs in units of σTOT, where σTOT accounts for the rms scatter in both the real- and redshift-space mocks. Dashed lines indicate where systematic errors equal to 1σTOT random errors.
Current usage metrics show cumulative count of Article Views (full-text article views including HTML views, PDF and ePub downloads, according to the available data) and Abstracts Views on Vision4Press platform.
Data correspond to usage on the plateform after 2015. The current usage metrics is available 48-96 hours after online publication and is updated daily on week days.
Initial download of the metrics may take a while.