Fig. 4
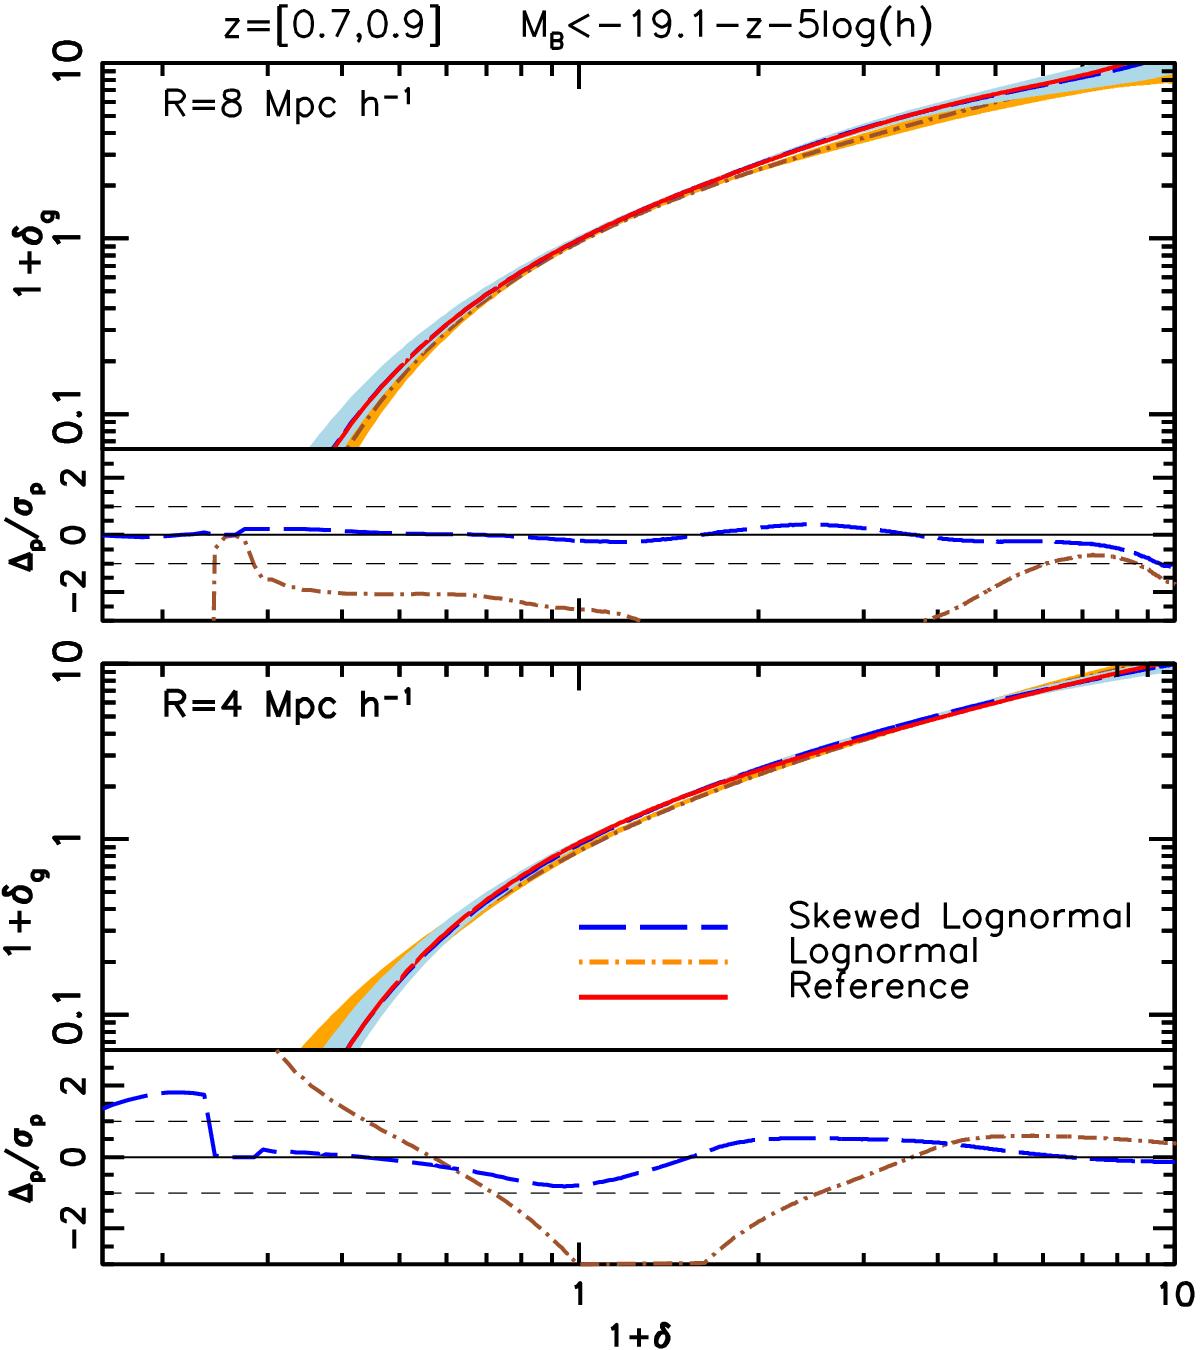
Solid red curve: reference mean biasing function of Fig. 3 computed using the mass PDF from N-body simulations. Brown dot-dashed curve and orange band: biasing function obtained using a lognormal fit to the mass PDF and 2σ scatter from the mocks. Blue dashed curve and blue band: biasing function obtained using a skewed lognormal fit to the mass PDF and 2σ scatter from the mocks. Bottom panels: difference Δp between the reconstructed and reference PDFs in units of the random error σp. Dashed lines indicate systematic errors equals to 1σp random errors.
Current usage metrics show cumulative count of Article Views (full-text article views including HTML views, PDF and ePub downloads, according to the available data) and Abstracts Views on Vision4Press platform.
Data correspond to usage on the plateform after 2015. The current usage metrics is available 48-96 hours after online publication and is updated daily on week days.
Initial download of the metrics may take a while.