Fig. 3
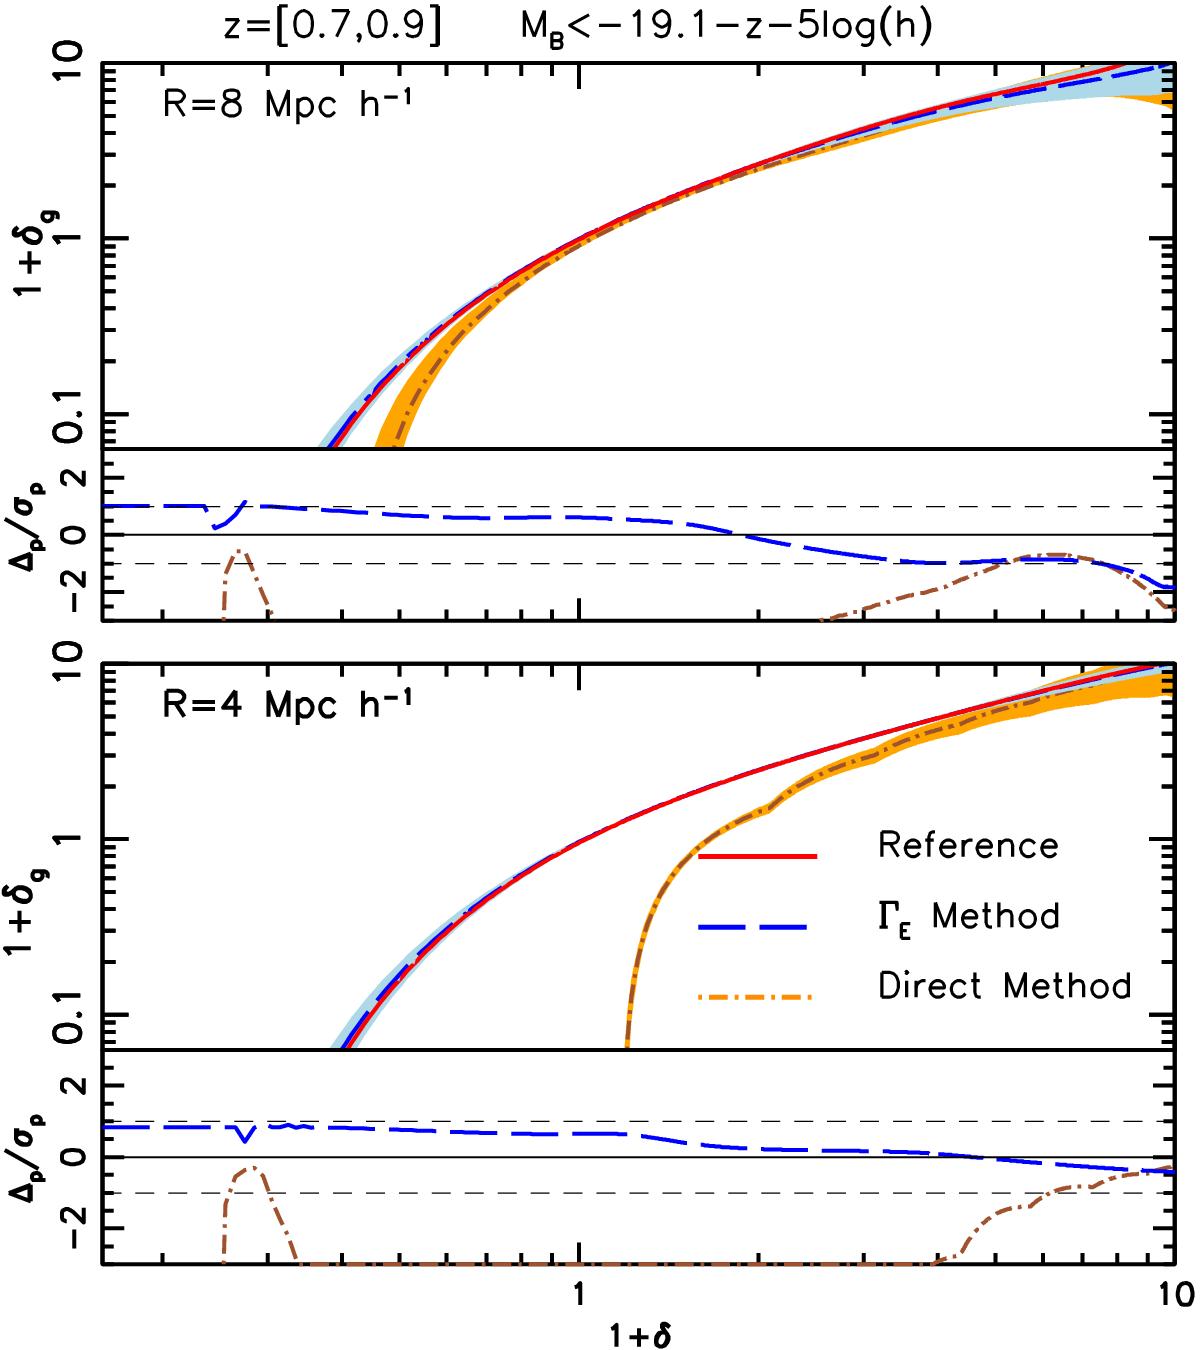
Mean biasing function of mock VIPERS galaxies computed from counts in cells of R = 4h-1 Mpc (bottom panel) and R = 8h-1 Mpc (top panel). The magnitude cut and redshift range of the mock VIPERS subsample, indicated in the plot, are the same as Fig. 2. Solid red curve: reference biasing function obtained from the Parent mock catalogues. Blue dashed curve and blue-shaded region: average value and 2σ scatter of the biasing function reconstructed from the Realistic mocks using the ΓE method. Brown dot-dashed curve and orange-shaded band: average value and 2σ scatter of the biasing function reconstructed from the Realistic mocks using a “direct” estimate of the galaxy PDF. Bottom sub-panels: difference Δp between the reconstructed and reference PDFs in units of the random error σp. Dashed lines indicate systematic errors equal to 1σp random errors.
Current usage metrics show cumulative count of Article Views (full-text article views including HTML views, PDF and ePub downloads, according to the available data) and Abstracts Views on Vision4Press platform.
Data correspond to usage on the plateform after 2015. The current usage metrics is available 48-96 hours after online publication and is updated daily on week days.
Initial download of the metrics may take a while.