Fig. 2
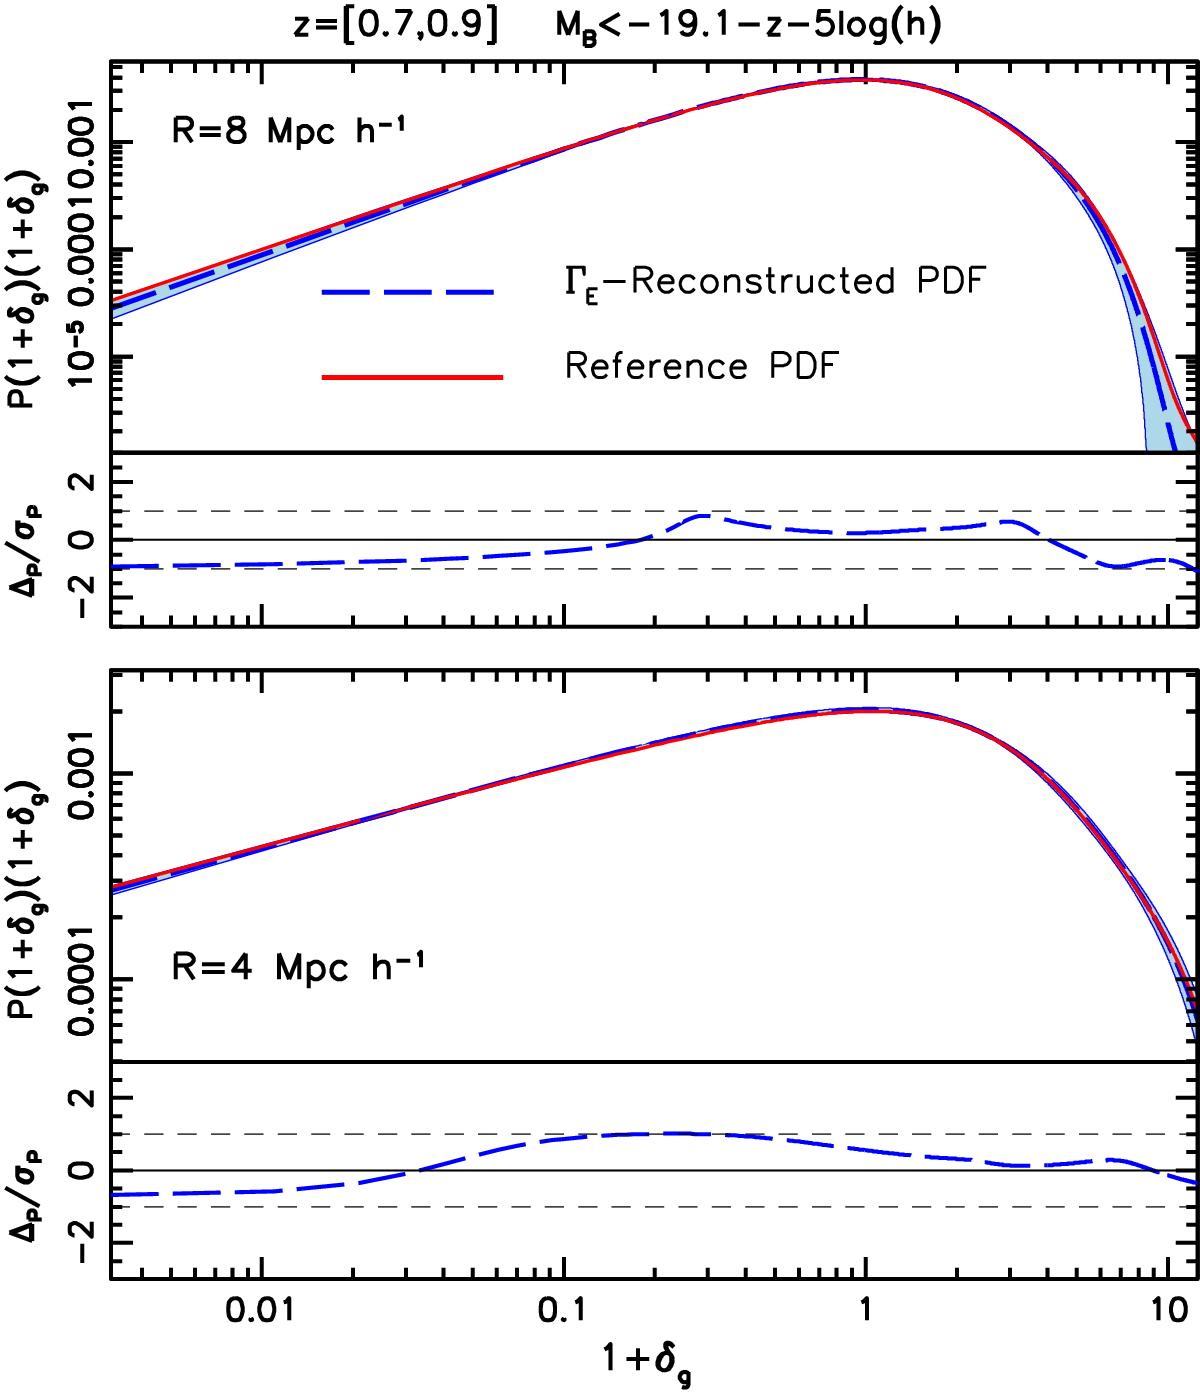
Reconstructed PDF of the mock VIPERS galaxies measured in cells of R = 4h-1 Mpc (top) and R = 8h-1 Mpc (bottom). The blue solid curve represents the reference galaxy PDF obtained by averaging over the PDFs reconstructed from the Parent mocks using the ΓE method. The blue dashed curve shows the average PDF reconstructed from the Realistic mocks using the same method. The blue shaded region represents the 1σ scatter among the 26 Realistic mocks. We plot P(1 + δg)(1 + δg) to highlight the performance of the reconstruction at high and low over-densities. We note the different Y-ranges in the two panels. The bottom panels in each plot show the difference Δp between the reconstructed and reference PDFs in units of the random error σp. Horizontal, dashed lines indicate systematic errors equal to 1σp random uncertainties.
Current usage metrics show cumulative count of Article Views (full-text article views including HTML views, PDF and ePub downloads, according to the available data) and Abstracts Views on Vision4Press platform.
Data correspond to usage on the plateform after 2015. The current usage metrics is available 48-96 hours after online publication and is updated daily on week days.
Initial download of the metrics may take a while.