Fig. 15
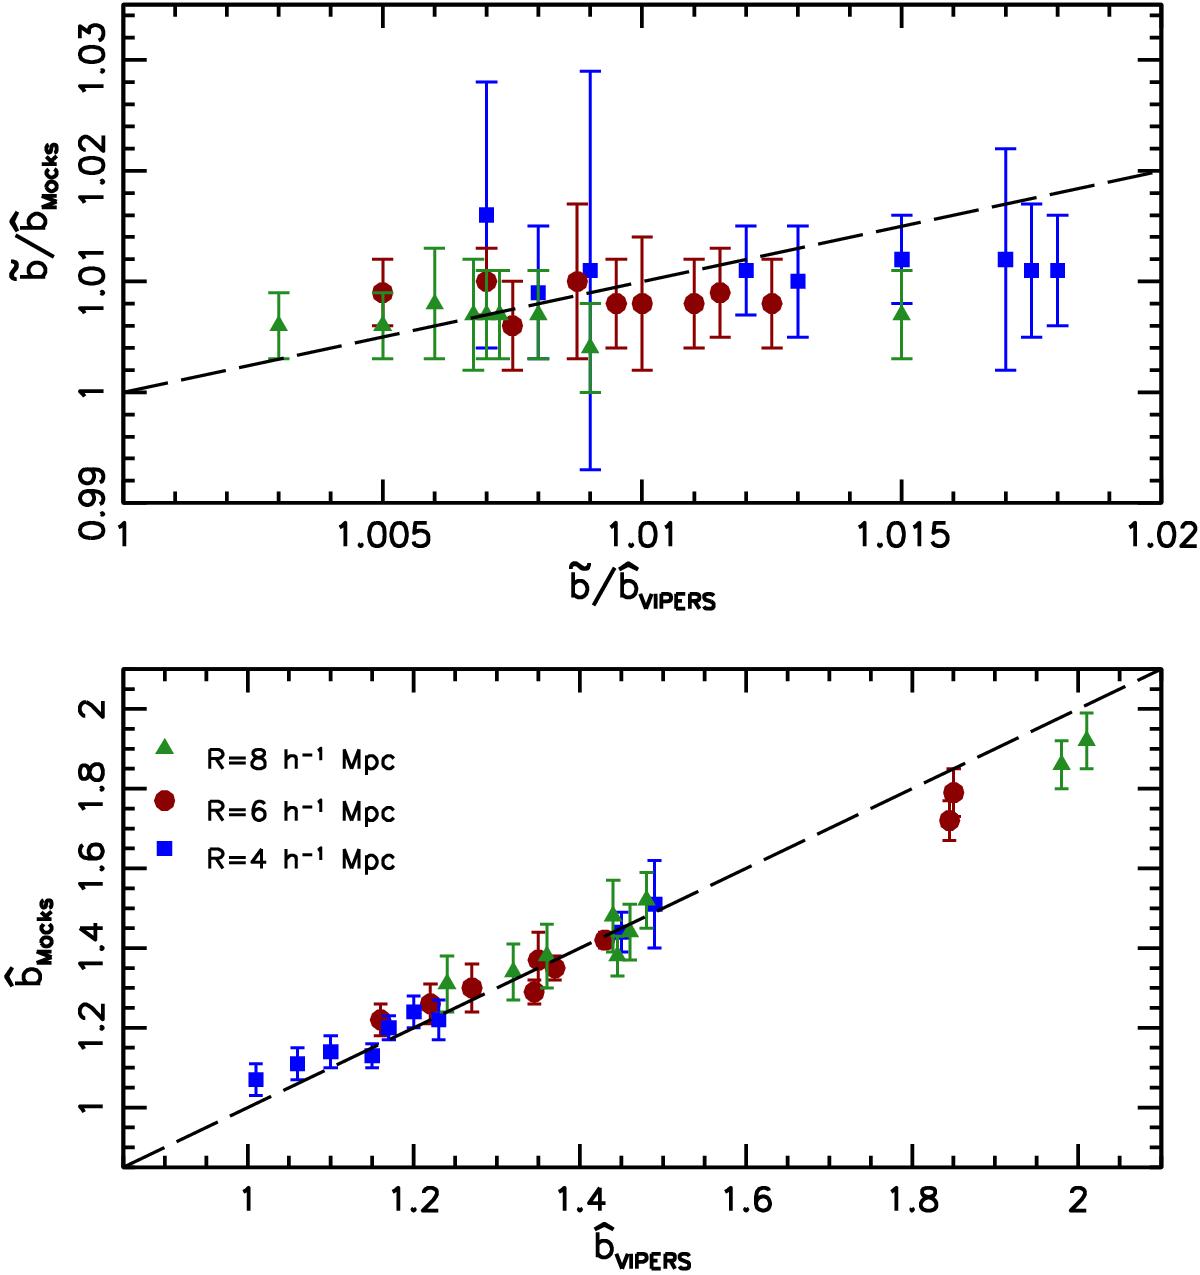
Bottom panel: comparison between ![]() measured in various mock subsamples and
measured in various mock subsamples and ![]() measured in the VIPERS catalogue. Different symbols and colours refer to results obtained with cells of different sizes, as indicated in the plot. The subsamples were obtained by applying the same magnitude and redshift cuts used in this section and indicated in Table 2. The error bars represent 1σ scatter from the mocks. Top panel: comparison among the non-linear parameters
measured in the VIPERS catalogue. Different symbols and colours refer to results obtained with cells of different sizes, as indicated in the plot. The subsamples were obtained by applying the same magnitude and redshift cuts used in this section and indicated in Table 2. The error bars represent 1σ scatter from the mocks. Top panel: comparison among the non-linear parameters ![]() measured in the mocks and in the real sub-catalogues.
measured in the mocks and in the real sub-catalogues.
Current usage metrics show cumulative count of Article Views (full-text article views including HTML views, PDF and ePub downloads, according to the available data) and Abstracts Views on Vision4Press platform.
Data correspond to usage on the plateform after 2015. The current usage metrics is available 48-96 hours after online publication and is updated daily on week days.
Initial download of the metrics may take a while.