Fig. 13
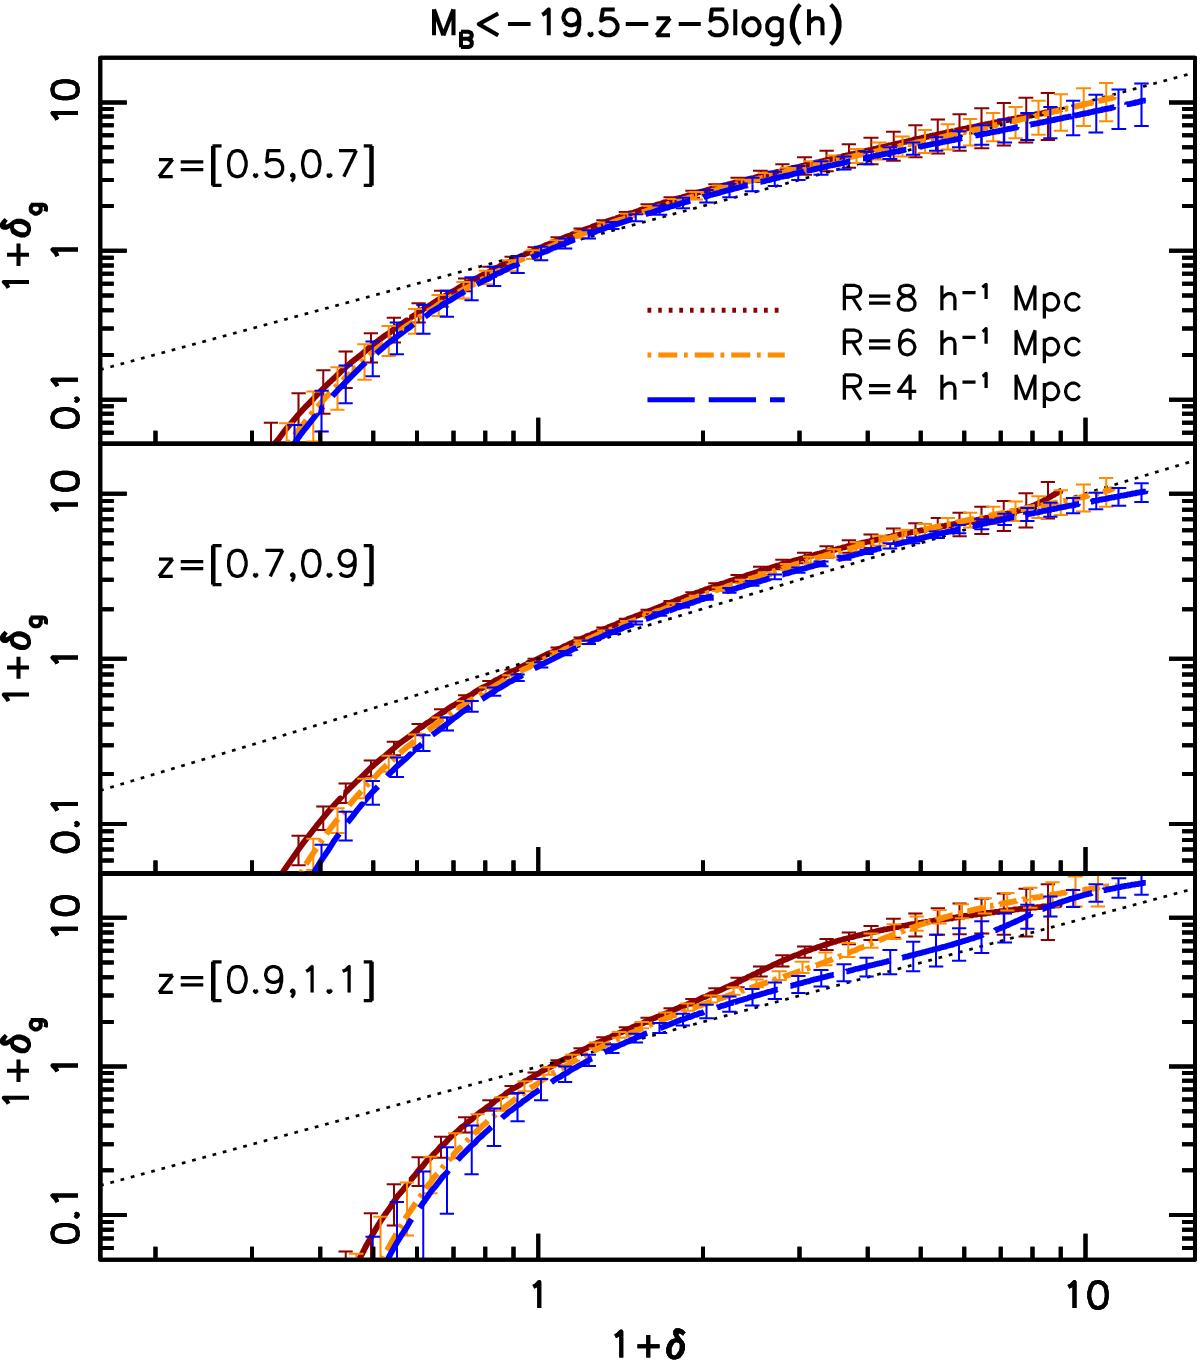
Mean biasing function of VIPERS galaxies with MB< −19.5−z − 5log (h) computed from counts in cells with radii of 4,6, and 8h-1 Mpc . Biasing functions at different scales are indicated with different colours and line styles, as indicated in the plots. Error bars represent the 2σ rms scatter in the mocks. Different panels refer to different redshift shells. An offset δ = 0.015 was applied to avoid overlapping error bars. Curves are plotted out to δMAX.
Current usage metrics show cumulative count of Article Views (full-text article views including HTML views, PDF and ePub downloads, according to the available data) and Abstracts Views on Vision4Press platform.
Data correspond to usage on the plateform after 2015. The current usage metrics is available 48-96 hours after online publication and is updated daily on week days.
Initial download of the metrics may take a while.