Fig. 11
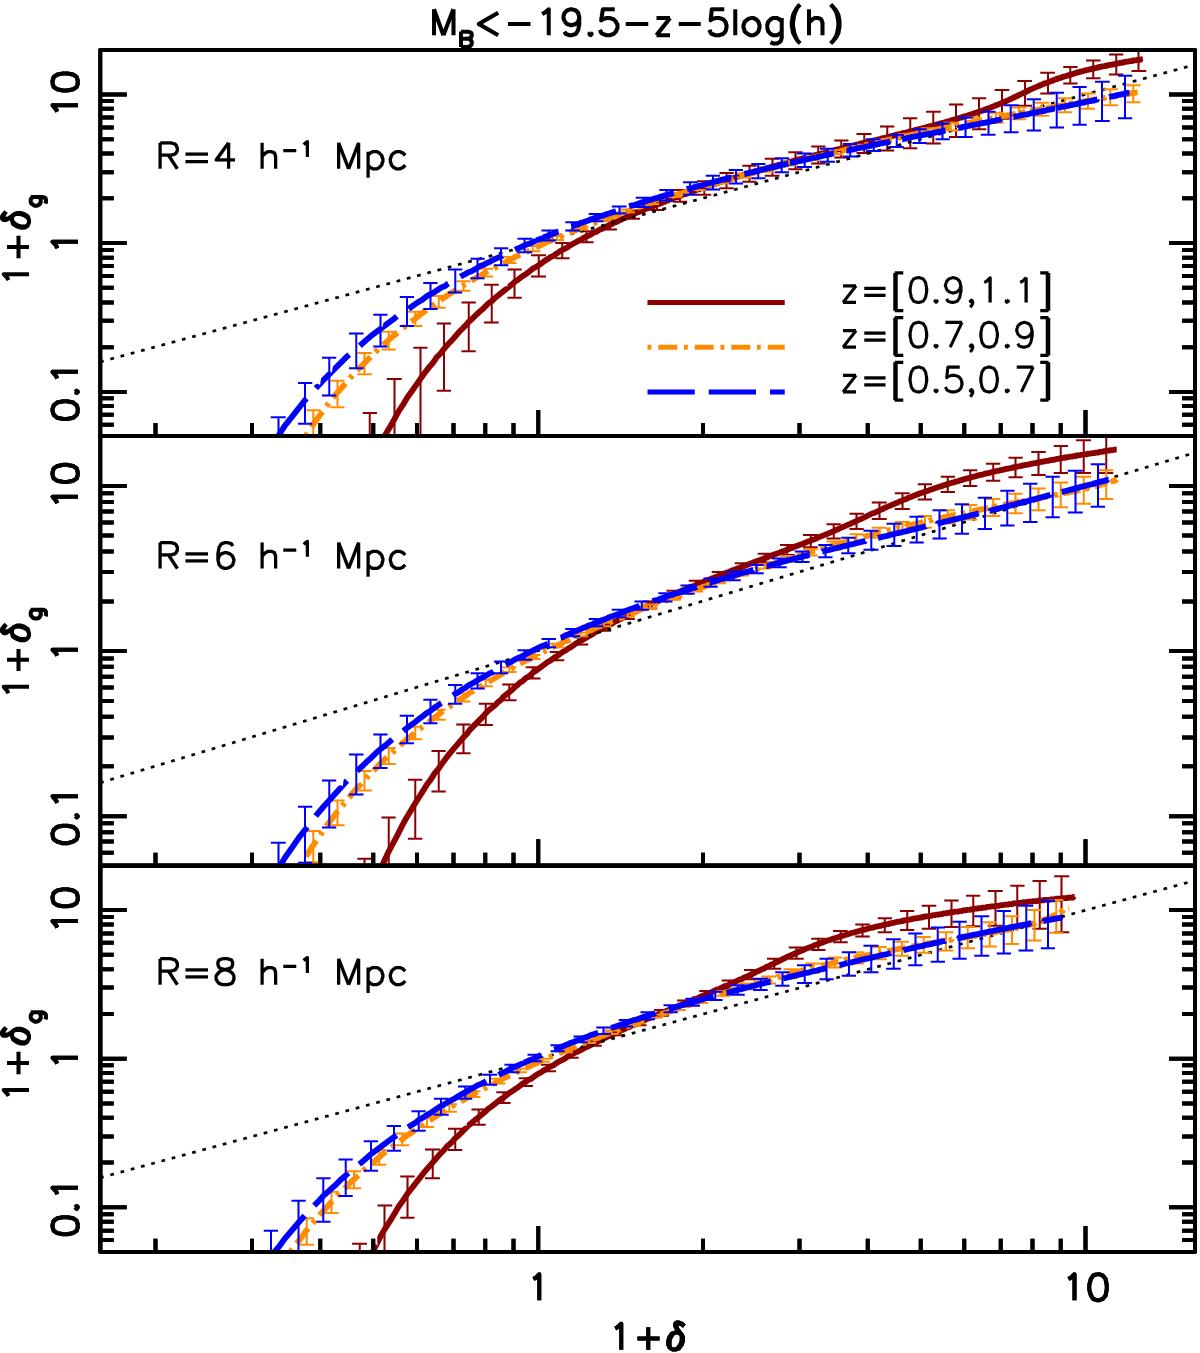
Mean biasing function of VIPERS galaxies with MB< −19.5−z − 5log (h) measured in different redshift bins, characterised by different colours and line-styles, as indicated in the plot. Error bars represents the 1σ scatter in the mocks. The three panels refer to different cell sizes with radii R = 4,6,8h-1 Mpc from top to bottom. A horizontal offset δ = 0.015 was applied to avoid overlapping error bars. All curves are plotted out to δMAX.
Current usage metrics show cumulative count of Article Views (full-text article views including HTML views, PDF and ePub downloads, according to the available data) and Abstracts Views on Vision4Press platform.
Data correspond to usage on the plateform after 2015. The current usage metrics is available 48-96 hours after online publication and is updated daily on week days.
Initial download of the metrics may take a while.