Fig. 10
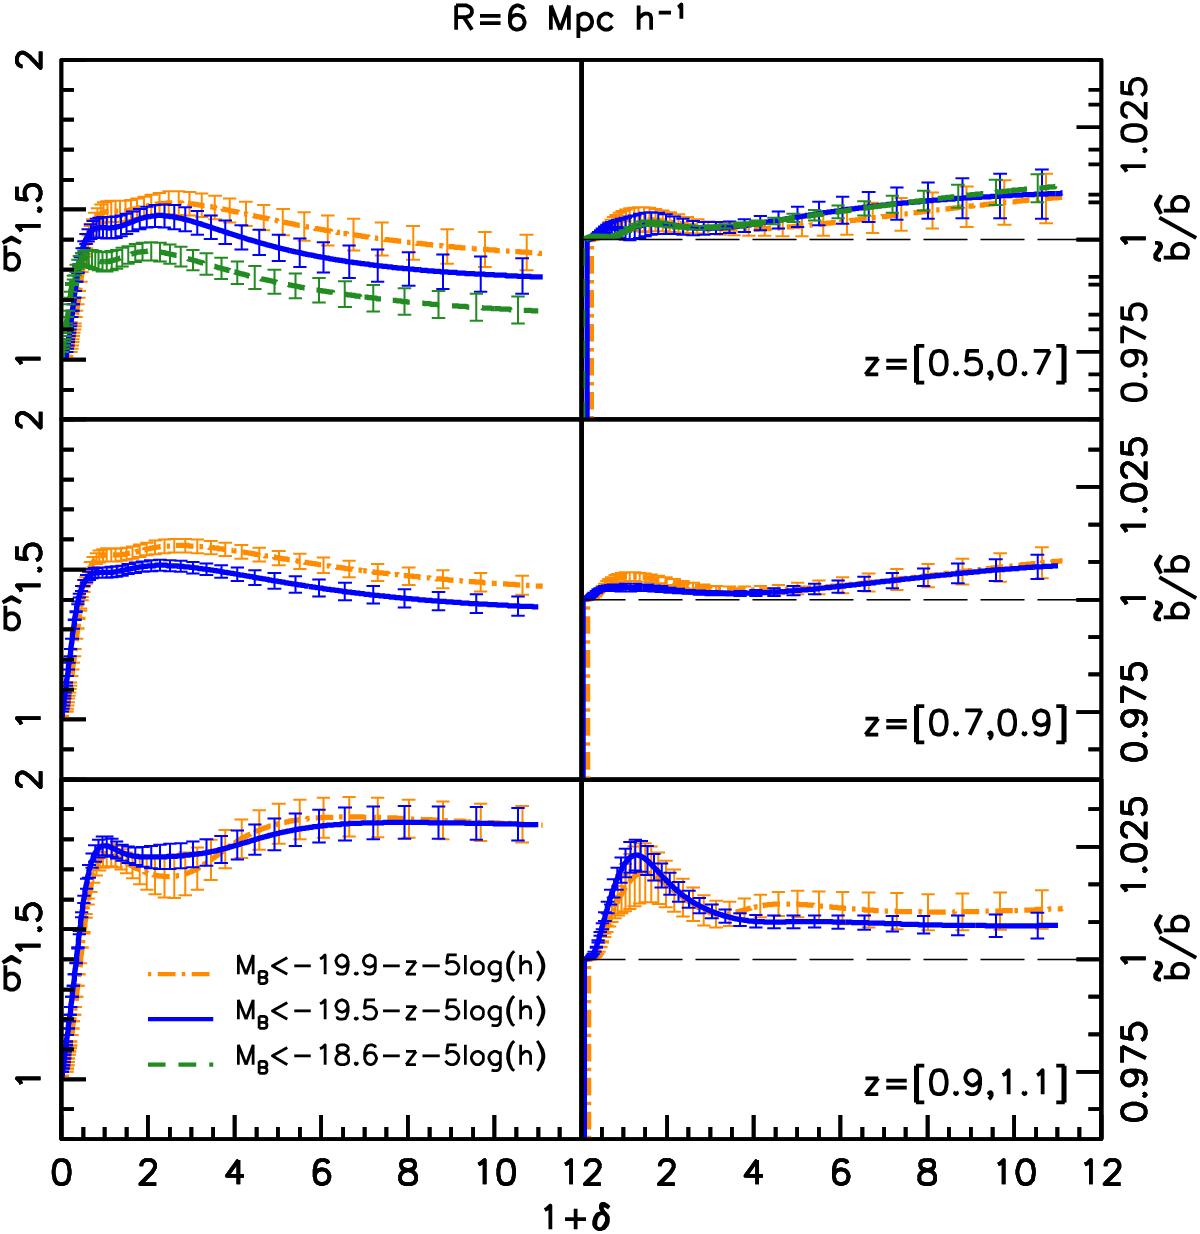
Left: second-order moment ![]() of the reconstructed mean biasing functions shown in Fig. 7. The cell size is R = 6h-1 Mpc . Different line styles and colours indicate different luminosity cuts listed in the plot. The redshift ranges and colour codes are the same as in Fig. 7. Error bars represent the 1σ scatter among the mocks. Right: similar plots showing the non-linear bias parameter
of the reconstructed mean biasing functions shown in Fig. 7. The cell size is R = 6h-1 Mpc . Different line styles and colours indicate different luminosity cuts listed in the plot. The redshift ranges and colour codes are the same as in Fig. 7. Error bars represent the 1σ scatter among the mocks. Right: similar plots showing the non-linear bias parameter ![]() . A horizontal offset δ = 0.015 was applied to avoid overlapping error bars. All curves are plotted out to δMAX.
. A horizontal offset δ = 0.015 was applied to avoid overlapping error bars. All curves are plotted out to δMAX.
Current usage metrics show cumulative count of Article Views (full-text article views including HTML views, PDF and ePub downloads, according to the available data) and Abstracts Views on Vision4Press platform.
Data correspond to usage on the plateform after 2015. The current usage metrics is available 48-96 hours after online publication and is updated daily on week days.
Initial download of the metrics may take a while.