Fig. 1
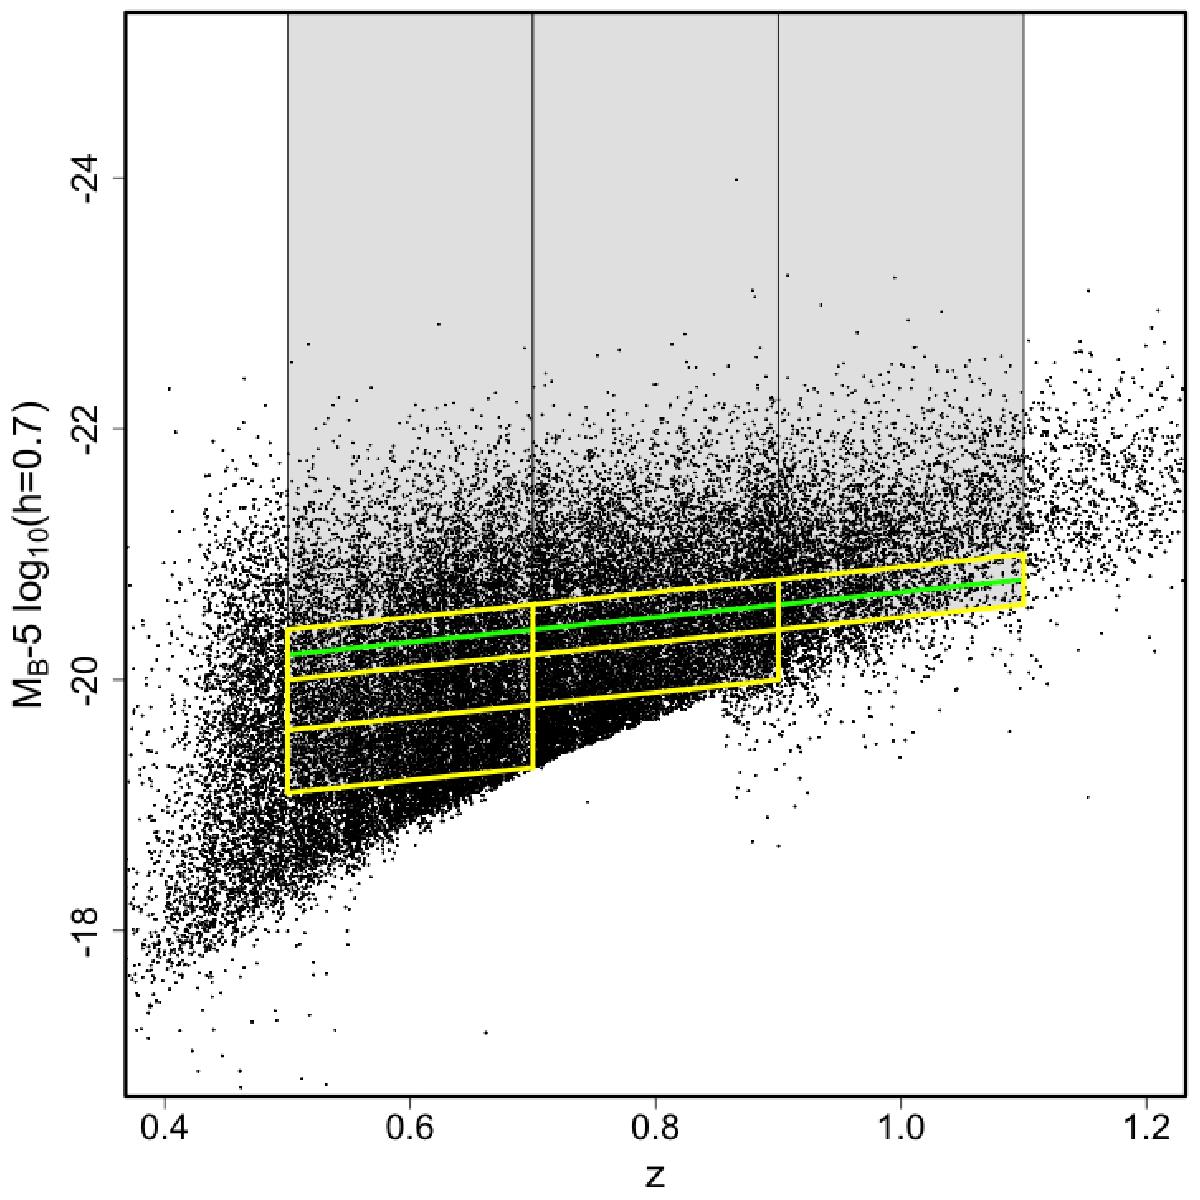
Luminosity selection as a function of redshift. The black dots show the W1 and W4 VIPERS galaxies (with spectroscopic redshift flag between 2 and 9.5). Yellow lines represent the principal magnitude cuts applied in every redshift bin. The green line represents the cut M0 = −19.7 − z made to compare our results to those of K11.
Current usage metrics show cumulative count of Article Views (full-text article views including HTML views, PDF and ePub downloads, according to the available data) and Abstracts Views on Vision4Press platform.
Data correspond to usage on the plateform after 2015. The current usage metrics is available 48-96 hours after online publication and is updated daily on week days.
Initial download of the metrics may take a while.