Fig. 7
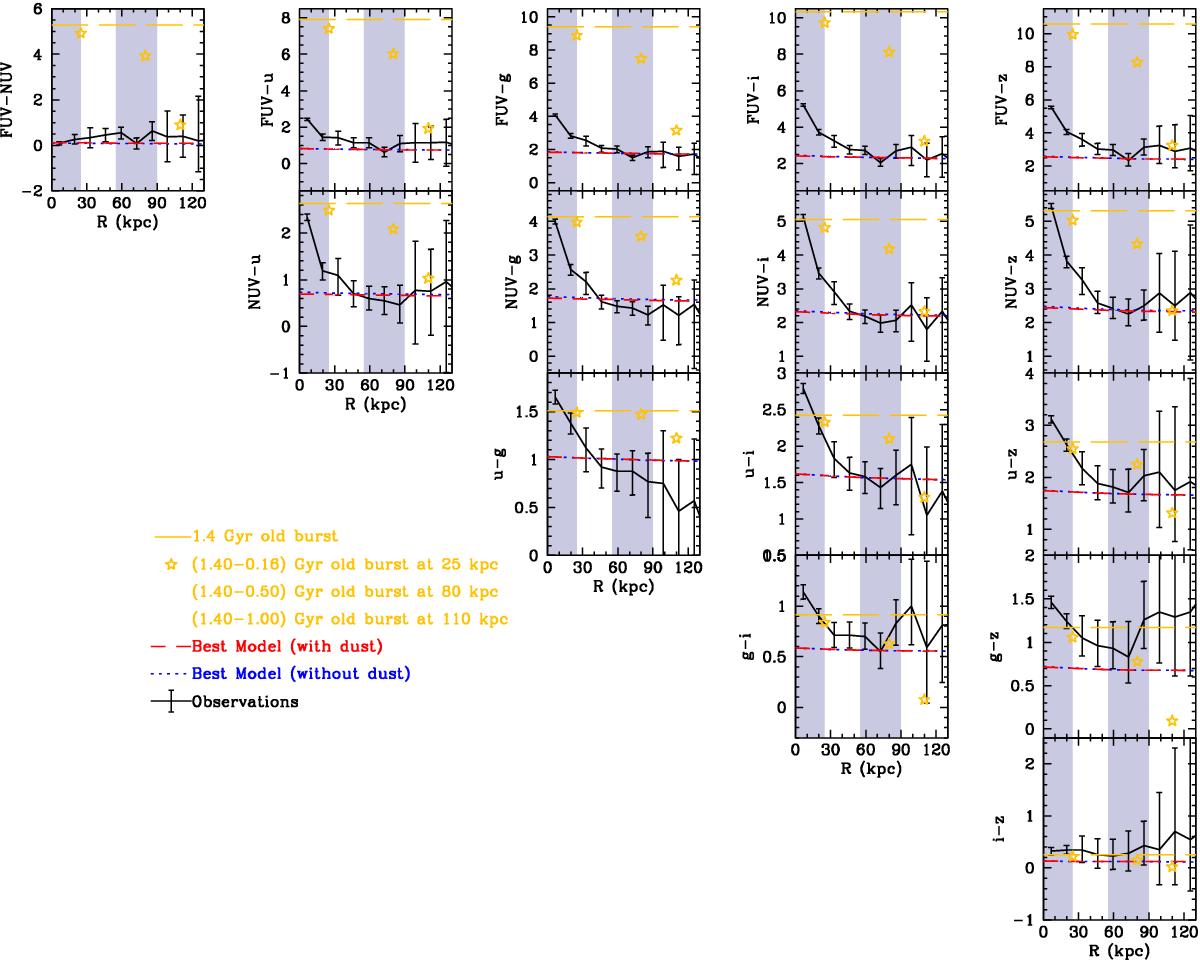
All the color indexes profiles we have access to, and comparison to model predictions. The top-left side shows the color sensitive to young stellar population, while the bottom-right colors are sensitive to older ones. We show the best model discussed in Sect. 5.1 (with our without dust) and the colors of a burst of age 1.4 Gyr (horizontal line), and different ages for different radii (stars). The shaded area show the regions excluded for the fit (bulge and bumps likely linked to the young populations of the spiral arm), but the color profile of the model is in full agreement with the observed one also in the remaining of the disk (within a few sigma).
Current usage metrics show cumulative count of Article Views (full-text article views including HTML views, PDF and ePub downloads, according to the available data) and Abstracts Views on Vision4Press platform.
Data correspond to usage on the plateform after 2015. The current usage metrics is available 48-96 hours after online publication and is updated daily on week days.
Initial download of the metrics may take a while.