Fig. 6
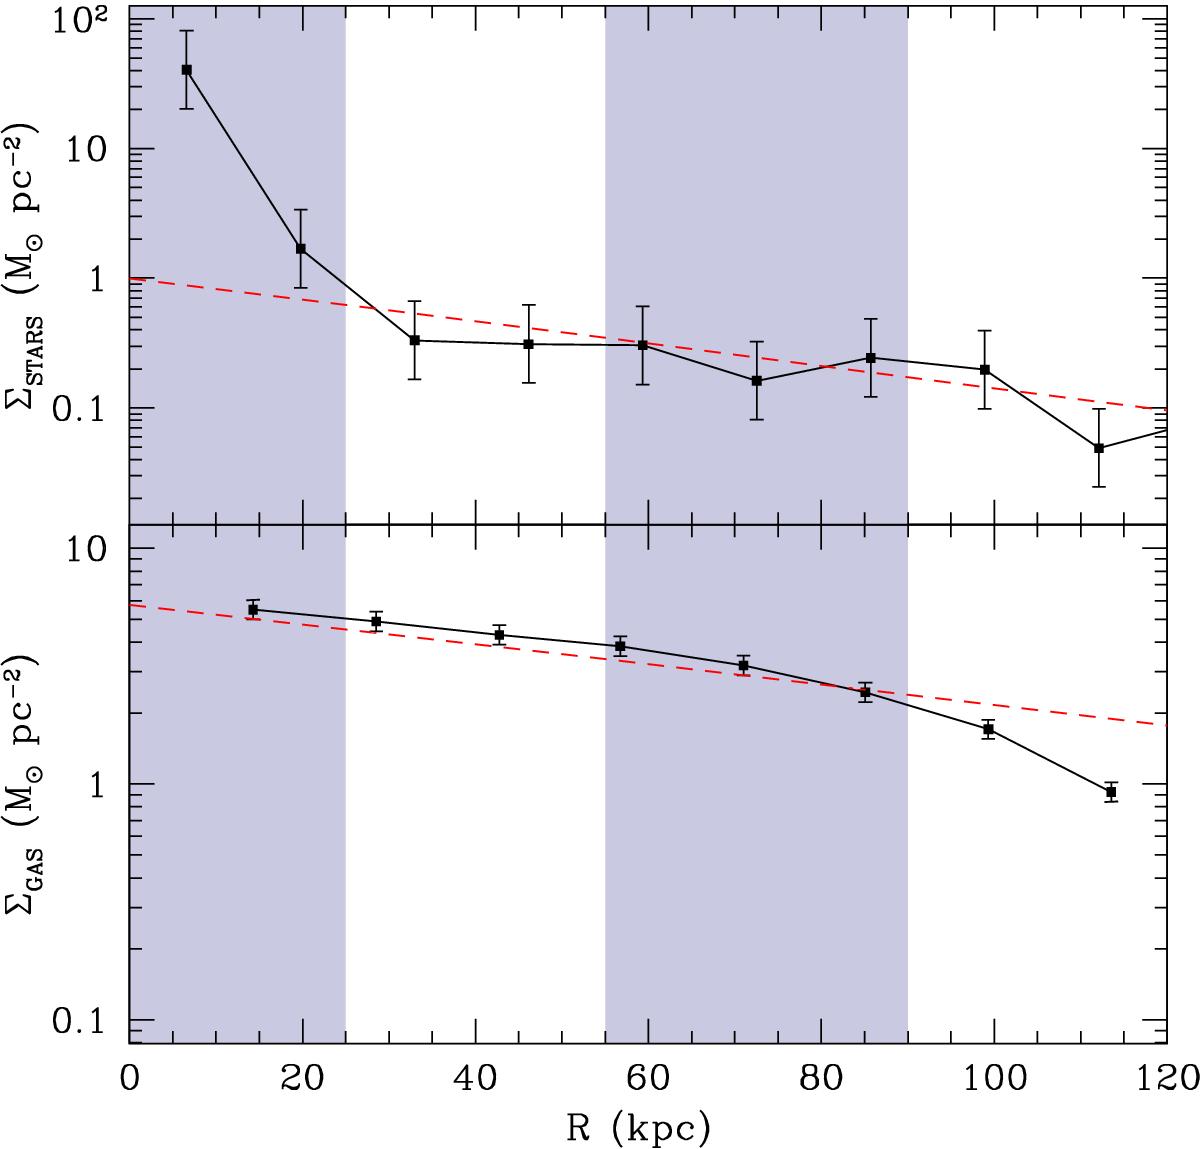
Top: stellar mass density profile (points) computed on the basis of the surface brightness profiles (see Sect. 5.1.3). The error-bars indicate a factor two. Many uncertainties affect this profile such as the photometric errors, but also the model-dependent fit assuming a family of star-formation history, or an initial stellar mass function, so the factor of two is purely illustrative. Bottom: gas column density profile (points), converted from HI by multiplying by a factor 1.4 from Lelli et al. (2010). Error-bars are not provided by Lelli et al. (2010) so a 10% uncertainty has been assumed. The shaded area indicates the regions excluded for the fit (based on the bulge and bumps observed in the photometric profiles) but the model is in agreement with the data also in the remaining of the disk. In both panels, the red dashed lines indicates our best model profile.
Current usage metrics show cumulative count of Article Views (full-text article views including HTML views, PDF and ePub downloads, according to the available data) and Abstracts Views on Vision4Press platform.
Data correspond to usage on the plateform after 2015. The current usage metrics is available 48-96 hours after online publication and is updated daily on week days.
Initial download of the metrics may take a while.