Fig. 5
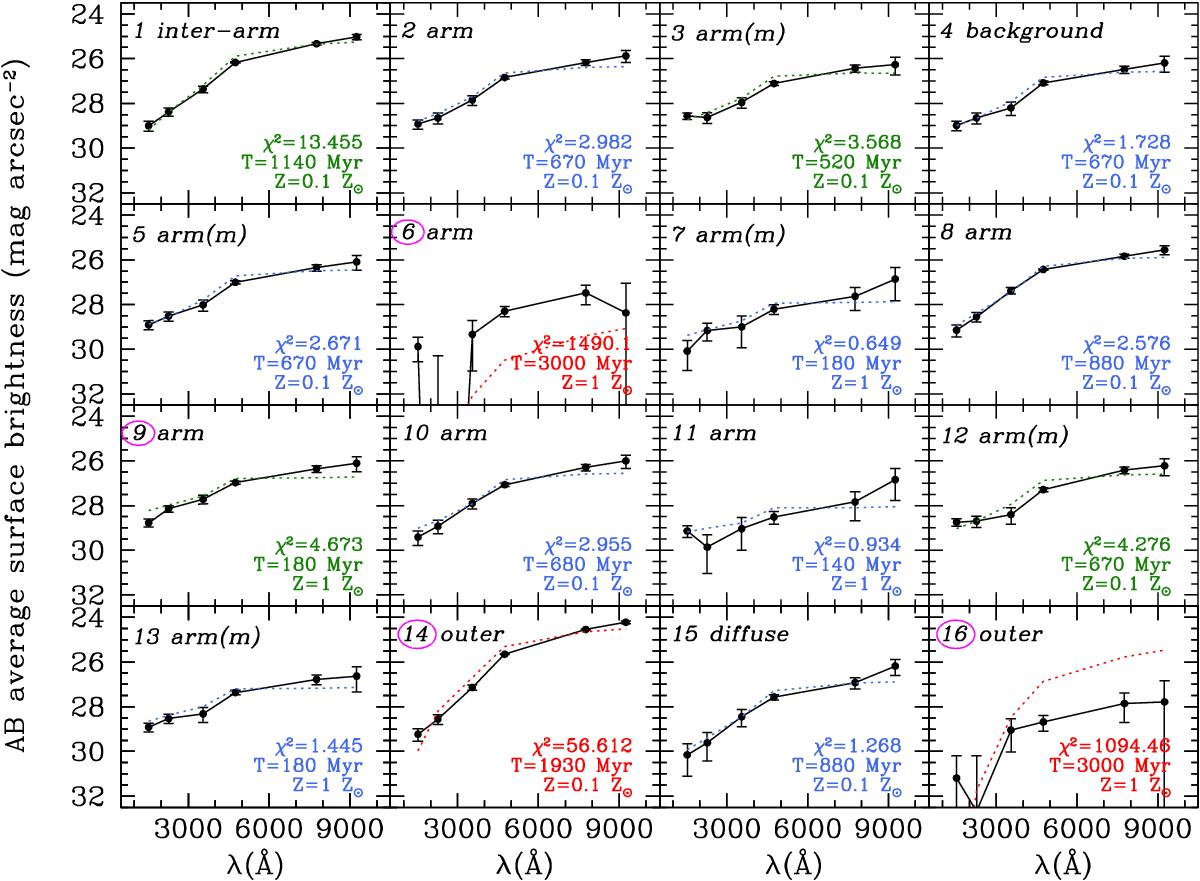
FUV to z SEDs for 16 selected regions (defined in Fig. 2 and in Sect. 4.1). The black lines with points and errorbars are the observed SEDs. The dotted line is the SED for the single generation fit (Sect. 4.2). The color indicates the quality of this fit: relatively good, average, bad fits are shown in blue, green and red, respectively, based on the χ2 value given in each panel. The number id of each region is circled for regions selected in ultra-violet, the other regions were chosen in the optical.
Current usage metrics show cumulative count of Article Views (full-text article views including HTML views, PDF and ePub downloads, according to the available data) and Abstracts Views on Vision4Press platform.
Data correspond to usage on the plateform after 2015. The current usage metrics is available 48-96 hours after online publication and is updated daily on week days.
Initial download of the metrics may take a while.