Fig. B.1
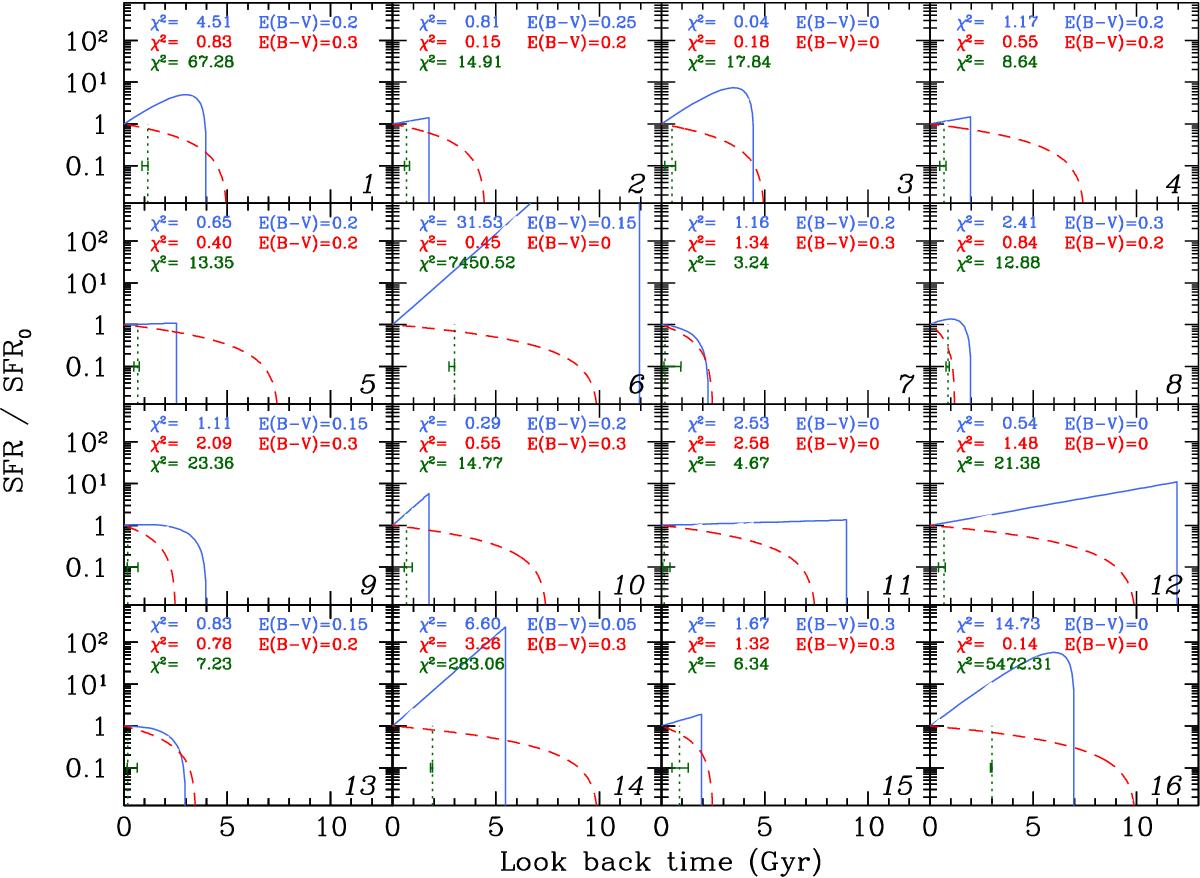
Star-formation history of individual regions for different models. The vertical dotted line indicates the age of a single population. The error-bar indicates the uncertainty on the age. The red dashed curve indicates the best star-formation history found by CIGALE. The blue solid curve indicates the best star-formation history found by Le Phare. In each panel, the non-reduced χ2 is given (from top to bottom: Le Phare, CIGALE, single generation). In the first two cases, the fit allows for the presence of dust, and the reddening of the best model is also given.
Current usage metrics show cumulative count of Article Views (full-text article views including HTML views, PDF and ePub downloads, according to the available data) and Abstracts Views on Vision4Press platform.
Data correspond to usage on the plateform after 2015. The current usage metrics is available 48-96 hours after online publication and is updated daily on week days.
Initial download of the metrics may take a while.