Fig. 1
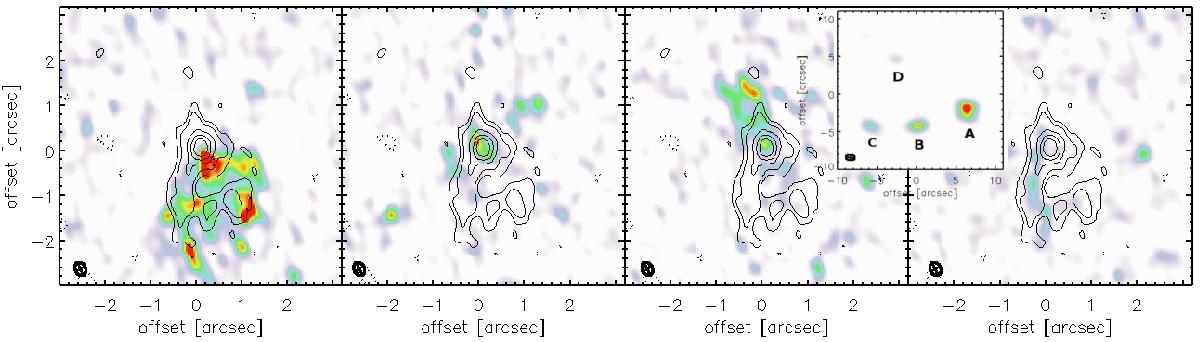
Left to right: [CII] channel maps centered on −500 km s-1, systemic velocity, + 100 km s-1, and + 350 km s-1, respectively, all relative to z = 3.427 and with a channel width of 87 km s-1. Contours show the continuum in the line-free spectral windows and are given for 3, 5, 10, 15, and 20σ. Negative contours are −3σ. The inset shows the SMA 850 μm image with all counter images; the gray circle is the primary beam of ALMA. The other panels show image A. The ALMA beam size in the lower left corner of each map corresponds to 150 pc at z = 3.4 (for μ = 20).
Current usage metrics show cumulative count of Article Views (full-text article views including HTML views, PDF and ePub downloads, according to the available data) and Abstracts Views on Vision4Press platform.
Data correspond to usage on the plateform after 2015. The current usage metrics is available 48-96 hours after online publication and is updated daily on week days.
Initial download of the metrics may take a while.