Fig. 3
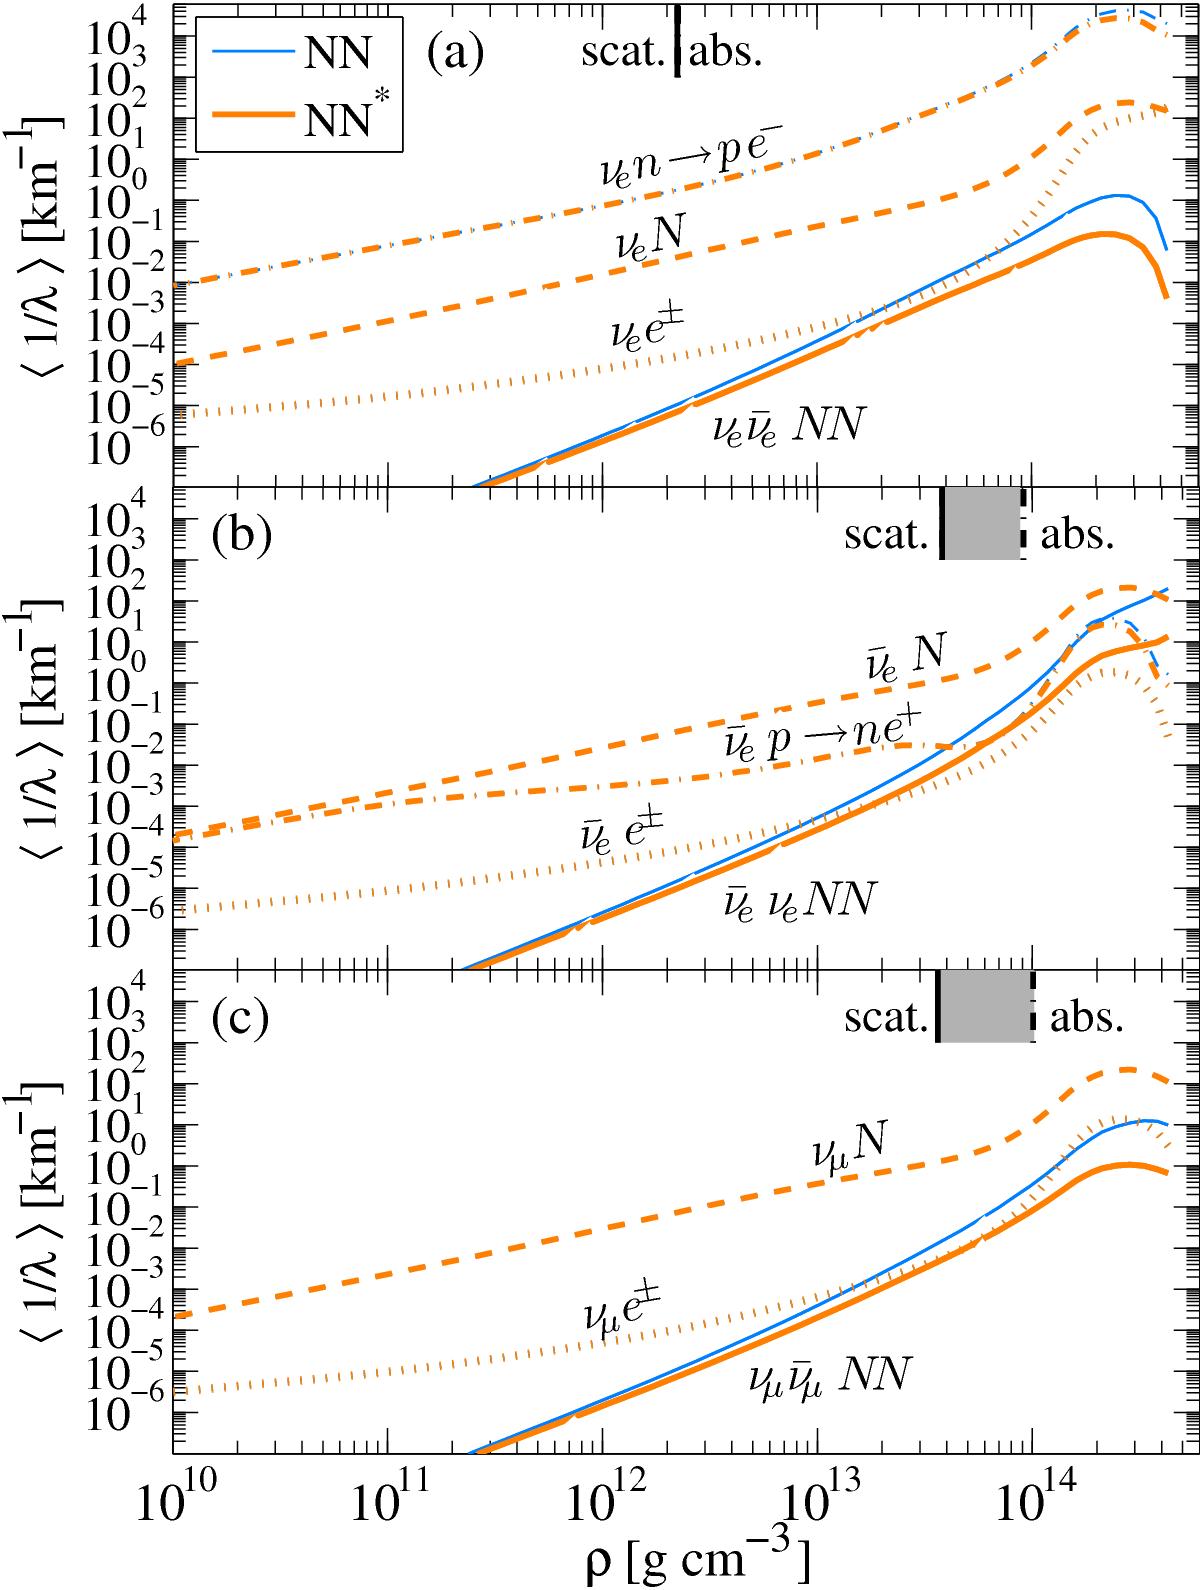
Density dependence of the average neutrino opacity (13)for selected weak processes, comparing NN (thin blue lines) and NN∗ (thick brown lines); see text for definitions. The corresponding conditions are shown in Fig. 4. Short vertical black lines at the top of graphs a)–c) mark the locations of the averaged neutrinospheres of last absorption labelled “abs.” (dash-dotted lines) and last elastic scattering labelled “scat.” (solid lines). The grey shaded region in between represents the scattering atmosphere.
Current usage metrics show cumulative count of Article Views (full-text article views including HTML views, PDF and ePub downloads, according to the available data) and Abstracts Views on Vision4Press platform.
Data correspond to usage on the plateform after 2015. The current usage metrics is available 48-96 hours after online publication and is updated daily on week days.
Initial download of the metrics may take a while.