Free Access
Fig. A.1
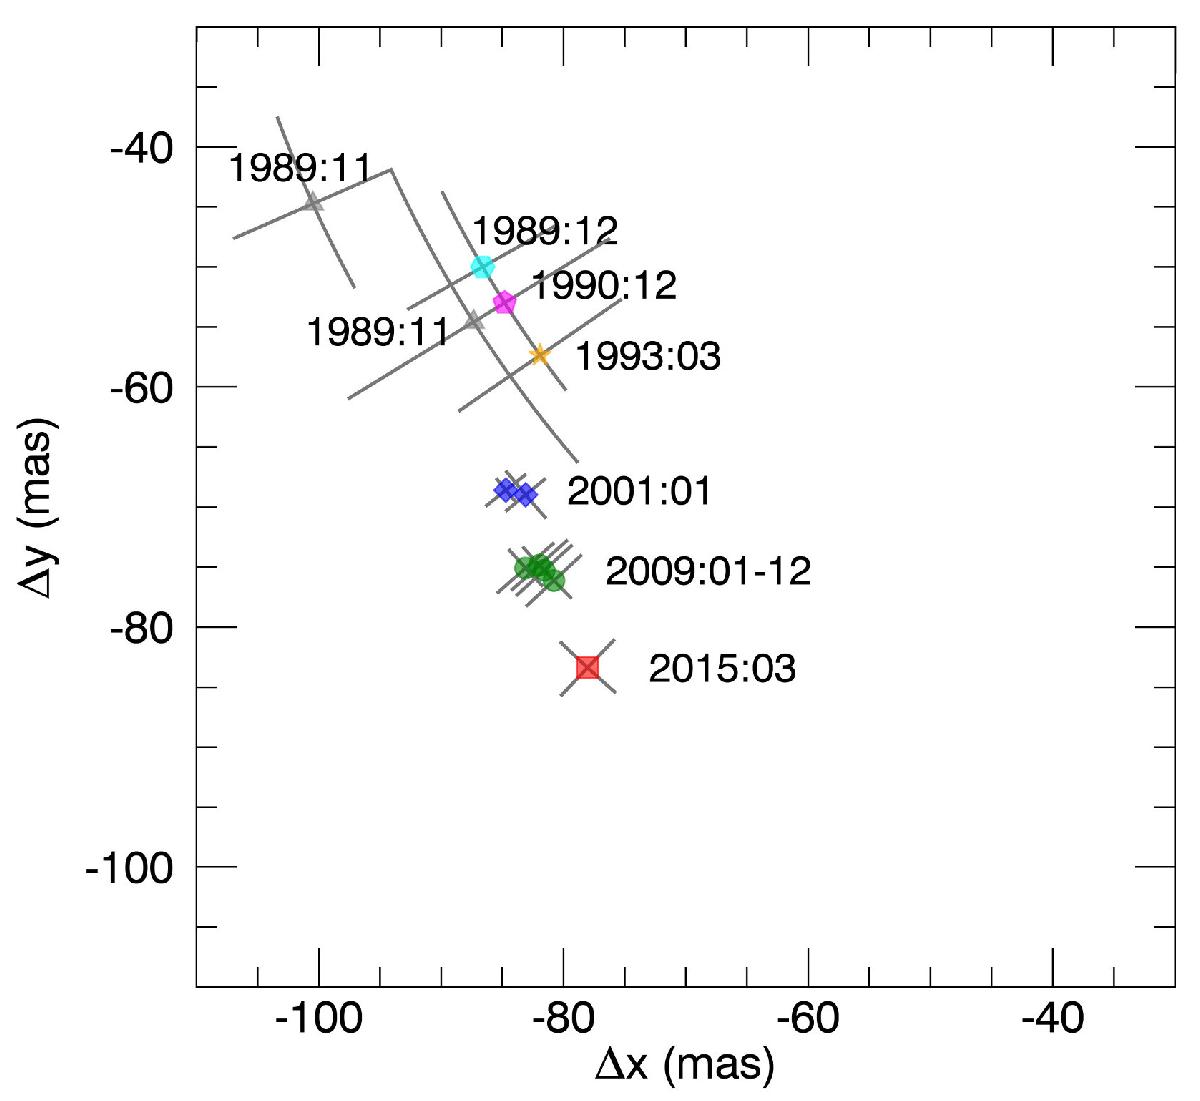
Relative position of the FUor component with respect to the Herbig from measurements. Labels report year:month of observation (see text for the references). The red point refers to our SPHERE observations.
Current usage metrics show cumulative count of Article Views (full-text article views including HTML views, PDF and ePub downloads, according to the available data) and Abstracts Views on Vision4Press platform.
Data correspond to usage on the plateform after 2015. The current usage metrics is available 48-96 hours after online publication and is updated daily on week days.
Initial download of the metrics may take a while.