| Issue |
A&A
Volume 593, September 2016
|
|
|---|---|---|
| Article Number | A104 | |
| Number of page(s) | 8 | |
| Section | Stellar atmospheres | |
| DOI | https://doi.org/10.1051/0004-6361/201628892 | |
| Published online | 30 September 2016 | |
The far-ultraviolet spectra of two hot PG 1159 stars
1 Institute for Astronomy and Astrophysics, Kepler Center for Astro and Particle Physics, Eberhard Karls University, Sand 1, 72076 Tübingen, Germany
e-mail: This email address is being protected from spambots. You need JavaScript enabled to view it.
2 NASA Goddard Space Flight Center, Greenbelt, MD 20771, USA
Received: 10 May 2016
Accepted: 7 July 2016
Abstract
PG 1159 stars are hot, hydrogen-deficient (pre-) white dwarfs with atmospheres mainly composed of helium, carbon, and oxygen. The unusual surface chemistry is the result of a late helium-shell flash. Observed element abundances enable us to test stellar evolution models quantitatively with respect to their nucleosynthesis products formed near the helium-burning shell of the progenitor asymptotic giant branch stars. Because of the high effective temperatures (Teff), abundance determinations require ultraviolet spectroscopy and non-local thermodynamic equilibrium model atmosphere analyses. Up to now, we have presented results for the prototype of this spectral class and two cooler members (Teff in the range 85 000–140 000 K). Here we report on the results for two even hotter stars (PG 1520+525 and PG 1144+005, both with Teff = 150 000 K) which are the only two objects in this temperature-gravity region for which useful far-ultraviolet spectra are available, and revisit the prototype star. Previous results on the abundances of some species are confirmed, while results on others (Si, P, S) are revised. In particular, a solar abundance of sulphur is measured in contrast to earlier claims of a strong S deficiency that contradicted stellar evolution models. For the first time, we assess the abundances of Na, Al, and Cl with newly constructed non-LTE model atoms. Besides the main constituents (He, C, O), we determine the abundances (or upper limits) of N, F, Ne, Na, Al, Si, P, S, Cl, Ar, and Fe. Generally, good agreement with stellar models is found.
Key words: stars: abundances / stars: atmospheres / stars: evolution / stars: AGB and post-AGB / white dwarfs
© ESO, 2016
1. Introduction
PG 1159 stars are hydrogen-deficient and occupy the hot end of the white dwarf cooling sequence (effective temperatures ranging between Teff = 75 000 K and 250 000 K, Werner & Herwig 2006; Werner et al. 2014; Werner & Rauch 2015). Their surfaces are dominated by helium-rich intershell matter dredged up by a late helium-shell flash (thermal pulse, TP). The main atmospheric constituents are helium and carbon (He = 0.30–0.92, C = 0.08–0.60, mass fractions), often accompanied by large amounts of oxygen (up to 0.20). The high abundances of C and O are witness to efficient overshoot of intershell convection in asymptotic giant branch (AGB) stars, drawing these elements from the C–O stellar core (Herwig et al. 1999; Herwig 2000; Miller Bertolami 2016). Measured overabundances of neon confirm this picture. Our investigation of these stars now concentrates on the trace elements up to the iron group. Quantitative spectroscopic abundance determinations can be compared to predictions from nucleosynthesis calculations in stellar evolution models for AGB stars.
The first comprehensive analysis of trace metal abundances was performed for the prototype of the PG 1159 spectroscopic class, PG 1159−035 (Teff = 140 000 K, Jahn et al. 2007). Then, two cooler objects from this group were analysed (PG 1424+535 and PG 1707+427, Teff = 110 000 and 85 000 K, Werner et al. 2015).
Prerequisites for these types of work are ultraviolet (UV) spectroscopic observations and model atmospheres accounting for departures from local thermodynamic equilibrium (LTE), because of the high effective temperatures. The far-UV spectral range covered by the Far Ultraviolet Spectroscopic Explorer (FUSE, 912–1188 Å) is a most rewarding source.
In the present paper, we assess the element abundances of two representatives of this group that are hotter than the prototype, namely 150 000 K: PG 1520+525 and PG 1144+005. They are the hottest PG 1159 stars for which useful FUSE data are available. For their analysis we developed new non-LTE model atoms, concentrating on high ionisation stages, particularly for elements not considered previously (Na, Mg, Al, Cl). We strive to identify spectral lines that have not been observed before in any stellar spectrum. The effective temperature of both stars is only rivaled by a few low-gravity PG 1159-type central stars with Teff up to 170 000 K (K1–16, RX J2117.1+3412, NGC 246, Longmore 4; Werner et al. 2010) for which good FUSE spectra are available. But for a comprehensive quantitative analysis, they require expanding-atmosphere models and the design of model atoms for even higher ionisation stages. In addition to the two program stars, we revisit the prototype itself. It is necessary and useful to analyse a larger number of these stars because, according to stellar models, the abundances of individual trace elements strongly depend on the stellar mass.
2. The program stars
Both stars analysed in this paper were discovered in the Palomar-Green Survey (Green et al. 1986). PG 1520+525 was identified as a very hot He-rich degenerate, classified a PG 1159 star, and a parameter estimate based on LTE models was attempted (Teff ≈ 100 000 K, log (g/cm s-2) > 6, Wesemael et al. 1985). PG 1144+005 was classified a PG 1159 star by Basile & Holberg (1985) and Green et al. (1986). Both objects are non-pulsators (Grauer et al. 1987), in contrast to many other PG 1159 stars, including the prototype (GW Vir variables). PG 1520+525 is the central star of an old planetary nebula (PK 085+52 1, Jacoby & van de Steene 1995).
2.1. PG 1520+525
The first non-LTE analysis was performed by Werner et al. (1991) using optical spectra. They found Teff = 140 000 ± 14 000 K, log g= 7.0 ± 0.5, He = 0.33, C = 0.50, O = 0.17 (element abundances in mass fractions). Nitrogen lines were not discovered and N < 4 × 10⁻³ was derived. Utilizing UV spectra taken with the Goddard High Resolution Spectrograph aboard the Hubble Space Telescope, these parameters were improved by Dreizler & Heber (1998): Teff = 150 000 ± 7500 K, log g= 7.5 ± 0.5, He = 0.44, C = 0.39, O = 0.17, N < 1.5 × 10⁻⁴. The slightly higher temperature was confirmed by the analysis of a Chandra/LETG soft-X-ray spectrum (150 000 ± 10 000 K, Adamczak et al. 2012).
Abundances of further elements were measured from FUSE spectra. Ne = 0.02 and F = 10-4 was determined (Werner et al. 2004, 2005). Preliminary results for other light element abundances were presented by Reiff et al. (2007): Si < 3.6 × 10⁻⁵, P = 6.4 × 10⁻⁶, S = 5.0 × 10⁻⁵. An upper abundance limit for argon of roughly solar was derived (Ar < 8 × 10⁻⁵, Werner et al. 2007a). From the lack of Fe vii lines, an upper abundance limit of Fe < 0.3 solar was estimated (Miksa et al. 2002). Finally, from a fit to newly identified Fe viii lines, a solar iron abundance was claimed (Werner et al. 2011).
2.2. PG 1144+005
The first non-LTE analysis was performed by Werner & Heber (1991) using optical spectra. They found Teff = 150 000 ± 15 000 K, log g= 6.5 ± 0.5, He = 0.39, C = 0.58, O = 0.016. A relatively high nitrogen abundance was determined (N = 0.015).
As in the case of PG 1520+525, abundances of further elements were measured from FUSE spectra. Ne = 0.02 was found from an analysis, including optical spectra (Werner et al. 2004) and F = 10-5 was determined (Werner et al. 2005). Preliminary results for other light element abundances were presented by Reiff et al. (2007): Si < 7.3 × 10⁻⁵, P = 6.4 × 10⁻⁶, S = 5.0 × 10⁻⁵. An upper abundance limit for argon of roughly solar was derived (Ar < 8 × 10⁻⁵, Werner et al. 2007a). From a fit to Fe viii lines in FUSE spectra, a solar iron abundance was determined (Werner et al. 2011).
3. Observations and line identifications
The raw FUSE data for the program stars were retrieved from the Mikulski Archive for Space Telescopes (MAST). The observation IDs were P1320201 for PG 1144+005, and P1320101, F0200101, F0200102 for PG 1520+525. Both were observed through the LWRS spectrograph aperture, and the data were obtained in time-tag mode. We describe the data reduction in some detail because the previous reductions in our earlier work did not go past the point of coaligning spectra from exposures for the eight individual channels separately, whereas now the spectra from the individual channels were combined into a single spectrum.
The exposures obtained in the observations P1320101 and P1320201 were photometric in all channels, with exposure-to-exposure flux variations under 1%, indicating good alignment, and consistent to within a few percent when comparing one channel to another. Only one exposure was successful in each of F0200101 and F0200102, and pointing was unstable for portions of these exposures; the resulting spectra were normalized to match the earlier P1320101 data.
Raw data were processed twice with CalFUSE v3.2.3: once with screening parameters set to extract data only during orbital night, and once to extract data during orbital day. Zero-point offsets in the wavelength scale were adjusted for each exposure by shifting each spectrum to coalign narrow interstellar absorption features. The individual exposures from each observation were then combined to form composite day and night spectra for each channel. The day and night spectra were then compared at the locations of all the known airglow emission lines. If the day spectra showed any excess flux in comparison to the night spectra at those wavelengths, the corresponding pixels in the day spectra were flagged as bad and were not included in subsequent processing. Significant airglow was only present during orbital night at Lyman β, and faint emission can be discerned at Lyman γ. This residual emission would affect fits to the interstellar absorption at these wavelengths, but has no impact on any of the analyses we present.
Some additional customized processing was performed for PG 1520+525. The first ≈350 s of the first and third exposures were lost to the limb-angle screening with the default processing settings. However, an examination of the data showed that the violation of the limb angle constraint was slight, so we modified the constraint check to regain over 700 s of exposure time. Similarly, 315 s were lost to burst screening in detector 2A during F0200101, and losses in F0200102 ranged from 135 s in detector 2B to 432 s in detector 1A. An examination of the raw data showed no obvious background enhancement from the event burst, so the processing was performed with a higher burst-detection threshold to regain the lost exposure time. The net exposure time was 6830 s for PG 1144+005, with just slight variations from channel to channel, and ranged from a low of 7758 s in the SiC1b spectrum to 8600 s in the LiF1a spectrum for PG 1520+525.
The final step was to combine the spectra from the four instrument channels into a single composite spectrum. Because of residual distortions in the wavelength scale in each channel, additional shifts of localized regions of each spectrum were required to coalign the spectra; these shifts were typically only 1–2 pixels. Bad pixels resulting from detector defects were flagged at this point and excluded from further processing. Finally, the spectra were resampled onto a common wavelength scale and combined, weighting by signal-to-noise ratio (S/N) on a pixel-by-pixel basis.
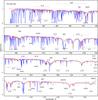 |
Fig. 1 FUSE spectrum of PG 1520+525 (thin black line) compared to a photospheric model spectrum (thick red line) with the finally adopted parameters as listed in Table 1. Prominent photospheric spectral lines are identified. Uncertain identifications are given in brackets. Unidentified, probably photospheric, lines are indicated by question marks. Geocoronal emission in the center of Lyman β was cut out. Overplotted in blue is the same model including ISM lines. |
The final spectrum has S/N = 13–23 per 0.013 Å pixel for PG 1520+525, and 14–26 per pixel for PG 1144+005. The effects of fixed-pattern noise are minimized by the fact that the positions of the spectra on the detectors varied during each observation, and by the fact that nearly every wavelength bin was sampled by at least two different detectors.
The FUSE spectra of both program stars (Figs. 1 and 2) are quite similar to that of the prototype PG 1159−035, as can be expected from the similar atmospheric parameters. They are dominated by broad lines from He ii, C iv, and O vi,and exhibit some lines of light metals that will be discussed below (see Jahn et al. 2007, for detailed line lists established for the prototype). In PG 1520+525, we also identify lines of O v, which are seen in PG 1159−035, too, but which were not identified in previous work (Jahn et al. 2007). Detailed information about O v lines was compiled for two cool PG 1159 stars (Werner et al. 2015). O v is not detected in PG 1144+005. Ionisation is shifted to higher stages because the surface gravity is one dex lower than that of PG 1520+525. We also see iron lines in PG 1159−035 and our program stars (Fe vii and Fe viii, Werner et al. 2011). Other species are discussed in detail below. The FUSE spectra shown in this paper were wavelength shifted such that the photospheric lines are at rest wavelengths according to the measured radial velocities of 15 ± 5 km s-1 and 10 ± 5 km s-1 for PG 1144+005 and PG 1520+525.
To identify lines from the interstellar medium (ISM) and to judge their potential contamination of photospheric lines, we used the program OWENS (Hébrard et al. 2002; Hébrard & Moos 2003). This can consider different clouds with individual radial and turbulent velocities, temperatures, column densities, and chemical compositions. In the FUSE observations of both stars, we identified ISM lines of H i, D i, H2, C i–iii, N i–ii, O i, Si ii, P ii, S iii, Ar i, and Fe ii. The blue graphs in Figs. 1 and 2 show the photospheric models including the ISM lines.
Interstellar reddening is E(B−V) = 0.015 ± 0.010 for both stars, determined by comparing model fluxes normalized to measured 2MASS infrared colours (Ks = 16.282 for PG 1144+005 and J = 16.381 for PG 1520+525, Debes et al. 2011) with the continuum flux and spectral shape of the FUSE spectra.
Final adopted parameters for the program stars PG 1144+005 and PG 1520+525.
4. Model atoms and model atmospheres
We used the Tübingen Model Atmosphere Package (TMAP) to compute non-LTE, plane-parallel, line-blanketed atmosphere models in radiative and hydrostatic equilibrium (Werner & Dreizler 1999; Werner et al. 2003). They include the three most abundant elements, namely He, C, and O. All other species were treated, one by one, as trace elements, i.e., keeping the atmospheric structure fixed. In the same manner, an extended model atom for C was introduced, meaning that non-LTE population numbers were computed for highly-excited levels, which were treated in LTE during the preceding model-atmosphere computations. Table 2 summarizes the number of considered non-LTE levels and radiative transitions between them. All model atoms were built from the publicly available Tübingen Model Atom Database (TMAD1, constructed as part of the German Astrophysical Virtual Observatory, GAVO), which is comprised of data from different sources, namely Bashkin & Stoner (1975), the databases of the National Institute of Standards and Technology (NIST2), the Opacity Project3 (OP, Seaton et al. 1994), CHIANTI4 (Dere et al. 1997; Landi et al. 2013), as well as the Kentucky Atomic Line List5. We put significant effort into the development and testing of model atoms for species that had not been investigated before in hot PG1159 stars (Na, Mg, Al, Cl) with an emphasis on the highest ionization stages.
For iron we used a statistical approach, employing typically seven superlevels per ion linked by superlines, together with an opacity sampling method (Anderson 1989; Rauch & Deetjen 2003). Ionization stages Fe vi–ix augmented by a single, ground-level stage Fe x were considered. We used the complete line list of Kurucz (so-called LIN lists, comprising about 1.2 × 10⁶ lines of the considered ions; Kurucz 1991, 2009, 2011) for the computation of the non-LTE population numbers, and the so-called POS lists (that include only the subset of lines with well known, experimentally observed line positions) for the final spectrum synthesis.
Number of non-LTE levels and lines of model ions used for line formation calculations of metals.
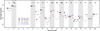 |
Fig. 3 Element abundances measured in five PG 1159 stars. Upper limits are indicated by arrows. Data for our two program stars and PG 1159−035 are from Table 1. Data for PG 1707+427 and PG 1424+535 are from Werner et al. (2015) except for the H abundances (from Werner et al. 1991). The black solid line indicates solar abundances. |
5. Results
For the abundance analysis, we adopted the effective temperature and surface gravity values of both stars that had been determined in previous work. We found no hint from the FUSE spectra that these values need improvement. This is corroborated by the relative strengths of Si v and Si vi lines which are well matched by the models. The new detection of many O v lines in PG 1520+525 together with O vi lines additionally confirms that the basic photospheric parameters, Teff and log g, are well established. The same holds for the abundance of the main atmospheric constituents (He, C, and O).
In the following, we discuss the abundance determinations for trace elements in detail. Results for the two program stars are given in Table 1 and compared to the prototype PG 1159−035. They are also displayed graphically in Fig. 3 in comparison to PG 1159−035 and two other previously analysed PG 1159 stars (PG 1707+427 and PG 1424+535, Werner et al. 2015). Typical errors are 0.3 dex.
Nitrogen.
The relatively high N abundance in PG 1144+005 was found from optical spectroscopy and cannot be further assessed with the FUSE spectrum. The strongest lines in the model are N v 4d–6f and 4f–6g at 1048.2 Å and 1049.7 Å, but they are blended by strong interstellar lines in the observation. The next strongest feature is the 4p–6d doublet at 1019.0/1019.3 Å, but it is blended by a strong photospheric O vi line and an interstellar line. For the same reason, the upper N limit for PG 1520+525, derived previously from the N v resonance doublet, cannot be improved.
Fluorine, neon, argon, iron.
The previously determined abundances of F, Ne, Ar (upper limits), and Fe in both stars are confirmed.
A weak Ne vi line appearing in the models at 1186.6 Å is possibly present in PG 1144+005. The line is not listed in the NIST and Kentucky databases but in the CHIANTI database. The oscillator strength given there is f = 0.068, while we use the larger OP value of f = 0.097 in our models. A stronger Ne vi line in the models, that is also listed in the NIST database, is seen at 972.93 Å (near the Ne vii 973.33 Å line). However, it is blended by strong interstellar lines.
The model for PG 1144+005 displays the 5f–6g and 5g–6h lines of Ar viii at 1155.0 and 1164.1 Å (Hegazy et al. 1997). However, their wavelength positions are not well enough known (± 0.84 and ± 1.2 Å, Kentucky database) to identify them with features in the observed spectra. We speculated about the presence of these argon lines in the hottest PG 1159 stars (e.g., K1–16, Werner et al. 2007b).
Sodium.
Our models predict detectable, i.e., strong enough lines of Na v and Na vi only at high abundances of the order 0.01. Even worse, the line positions are not sufficiently accurate. In the model for PG 1144+005, a weak Na vii line with well known wavelength position (1114.08 Å, NIST) appears, but no tight abundance limit can be derived (Na < 0.01). Neither the model for PG 1520+525 exhibits this line because of its higher gravity, nor the model for PG 1159−035, because of its lower temperature.
Magnesium.
Our models predict Mg v lines which should be detectable if the abundance is higher than about 10-3. Unfortunately, these lines are not listed in NIST and Kentucky databases so that their wavelength position seems uncertain. Consequently, not even an upper limit can be derived. The same holds for a single Mg vii line in the model for PG 1144+005.
Aluminum.
Our models predict weak lines from Al v and Al vi that can be used to assess the Al abundance. The strongest computed lines of these ions are Al v 1068.26 Å and 1088.67 Å, that are the strongest components of 4Po–4D and 4Do–4F multiplets, and Al vi 1056.00 Å, the strongest component of a 5P–5Do multiplet. In PG 1520+525, weak line features are at these wavelength positions. However, we regard these identifications as uncertain. An upper limit of Al < 3.2 × 10⁻⁴ (about six times solar) can be derived. In the model for PG 1144+005, the ionisation of Al shifts to higher stages because of the lower gravity (hence lower particle densities). Therefore, the derived upper limit is less strict, namely Al < 1.0 × 10⁻³. The Al abundance in the prototype, PG 1159−035, has hitherto not been investigated. Using an appropriate model atmosphere, we derive Al < 3.2 × 10⁻⁴.
Silicon.
We identified a few weak lines from Si v (975.8, 1118.8 Å) and Si vi (1131.0, 1142.4, 1148.6, 1152.8 Å). We obtain best-model fits at a solar abundance value (Si = 6.6 × 10⁻⁴) for both stars, hence, we do not confirm the stricter upper limits derived by Reiff et al. (2007) from the absence of Si iv lines in the FUSE observations.
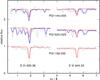 |
Fig. 4 Model fits to the S vi resonance doublet in the two program stars and in the prototype PG 1159−035, with parameters as given in Table 1. In PG 1144+005 and PG 1520+525, the 933.38 Å component is blended by an interstellar H2 line. Red curves: pure photospheric spectrum. Blue curves: ISM lines included in the model (not for PG 1159−035). |
Phosphorus.
From the nondetection of the P v resonance doublet (1118, 1128 Å), we derive an upper limit of P < 3.0 × 10⁻⁵ for both stars. This value is more conservative than the limits claimed by Reiff et al. (2007).
Sulphur.
From the S vi 933/944 Å resonance doublet (Fig. 4) and from two much weaker subordinate lines at 1000.5 Å and 1117.8 Å, we find S = 1.0 × 10⁻⁴ and 3.1 × 10⁻⁴ for PG 1144+005 and PG 1520+525, respectively, being solar within error limits. This result is in stark contrast to the earlier results reported by Reiff et al. (2007) that indicate a one dex subsolar abundance for these stars. We discovered that the low S values resulted from an error in the S vi model atom (wrong statistical weights for two energy levels) employed for the computation of the non-LTE population numbers.
We mention that the error in the model atom also affected the sulphur abundance determination in the prototype PG 1159−035 in our earlier work (Jahn et al. 2007). A surprisingly low value of just 2% solar was found, whereas a reanalysis with our corrected model atom arrives at a solar abundance.
Chlorine.
Lines of Cl vii enable us to put an upper abundance limit, though it is not very tight. Cl vii is a one-valence-electron system. The strongest predicted lines are from the 4d–5p transition (997.03 Å and 999.32 Å) and the 5f–7g transition at 944.1 Å but, for the latter, the wavelength uncertainty is too large (0.57 Å; Kentucky database). From the former we find Cl < 10-3 for both program stars as well as for PG 1159−035.
6. Summary and discussion
We have analysed FUV spectra of two hot PG 1159 stars (PG 1144+005 and PG 1520+525, both Teff = 150 000 K) with the focus on element abundance determinations. Previously obtained values for Teff and log g were confirmed. With our improved model atmospheres, we additionally derived new findings on the prototype itself (PG 1159−035; 140 000 K). The results for these three objects are summarized in Table 1. In Fig. 3, the element abundances are displayed, together with the results for two cooler PG 1159 stars (PG 1707+427 and PG 1424+535 with 85 000 and 110 000 K; Werner & Rauch 2014). Taken together, these five objects represent the only PG 1159 stars with comprehensive element abundance determinations.
Asteroseismic, spectroscopic, and initial masses of the five considered PG 1159 stars.
For the comparison of the results with evolutionary models, stellar masses are relevant. In Table 3 we list the spectroscopic masses derived by comparing them with the observed values of Teff and log g with evolutionary tracks by Althaus et al. (2009). For the two pulsators in the sample, asteroseismic masses are also available, being in good agreement with the spectroscopic values. Also listed are the masses of the main-sequence progenitors, as estimated from the initial-to-final mass relation of Weidemann (2000), taking into account the uncertainties of the spectroscopic masses.
The previously determined abundances of the main atmospheric constituents (He, C, O, Ne) in our two program stars were confirmed. The same holds for N, F, Ar, and Fe. The investigation on Si, P, and S gave improved results compared to earlier, preliminary work. For the first time, we have assessed the abundances of Na, Al, and Cl, and derived upper limits.
We used our model atmosphere grid to reassess the abundances of trace elements in the prototype PG 1159−035. The main result is an improved S abundance, which is solar in contrast to the strong S depletion (0.02 solar) claimed by Jahn et al. (2007), which was caused by an error in the model atom. We also derived upper limits for Na, Al, and Cl for this star.
The results can be compared to evolutionary models by Shingles & Karakas (2013), who presented intershell abundances for stars with initial masses of 1.8–6 M⊙. For PG 1159−035, the authors found good agreement for the species investigated (He, C, O, F, Ne, Si, P, S, Fe) with the exception of sulphur. As pointed out, this discrepancy is now resolved. For the two cool PG 1159 stars mentioned above, good agreement of observed and predicted element abundances was found (Werner & Rauch 2014). As to our two program stars, all element abundances are similar to those found for the other three PG 1159 stars (Fig. 3) and, hence, confirm the evolutionary models. For a thorough discussion, we can therefore refer to Werner & Rauch (2014), however, N, Na, Al, and Cl deserve particular attention here. The Na and Cl abundances in PG 1159 stars were examined for the first time.
PG 1144+005 is remarkable because of its relatively large N abundance. This phenomenon is shared by some other PG 1159 stars (like the mentioned cooler object PG 1707+427) and is attributed to the fact that these objects suffered their last thermal pulse when they already were white dwarfs (so-called very late thermal pulse, VLTP).
Only for PG 1144+005 could a useful upper limit for the sodium abundance be derived, which is 341 times oversolar. Karakas & Shingles (priv. comm.) report that the Na intershell abundance at the last thermal pulse in the 1.8 and 3 M⊙ models presented in Shingles & Karakas (2013) has increased considerably to 23.1 and 18.1 times oversolar after the last thermal pulse. This is still well below our detection limit.
For aluminum, upper limits of 18 and 6 times solar were derived for PG 1144+005 and PG 1520+525. The Al intershell abundance at the last thermal pulse in the mentioned 1.8 and 3 M⊙ models is 1.5 and 2 times the initial solar value. Hence, the rather modest production of Al is confirmed by our result.
For the two program stars, as well as for PG 1159−035, only a high upper limit of Cl = 10-3 was derived, which is about two dex oversolar. The intershell abundance in the 1.8 M⊙ and 3 M⊙ models has increased to 2.3 and 2.1 times oversolar after the last thermal pulse, i.e., well below our detection limit.
To summarize, the abundances of elements up to iron in PG 1159 stars is in good agreement with intershell abundances predicted by stellar-evolution models. For a number of interesting species (Na, Al, Cl), however, only upper limits can be derived by spectral analyses. It turned out that for the relevant ionisation stages (iv–vii), precise atomic data is lacking, impeding line identifications. This obstacle can only be overcome by laboratory measurements. The detailed investigation into the trace element abundances as a function of stellar mass is additionally hindered by the relatively large uncertainty in the spectroscopic mass determination, which itself is due to the uncertainty of the surface gravity measurement (± 0.5 dex). Considerable improvement is expected from accurate parallaxes that will be provided by Gaia.
Acknowledgments
We thank Amanda Karakas and Luke Shingles for reporting unpublished results to us. T. Rauch is supported by the German Aerospace Center (DLR) under grant 50 OR 1507. The TMAD service (http://astro-uni-tuebingen.de/~TMAD) used to compile atomic data for this paper was constructed as part of the activities of the German Astrophysical Virtual Observatory. This research has made use of the SIMBAD database, operated at CDS, Strasbourg, France, and of NASA’s Astrophysics Data System Bibliographic Services. Some of the data presented in this paper were obtained from the Mikulski Archive for Space Telescopes (MAST). This work had been done using the profile fitting procedure OWENS, developed by M. Lemoine and the FUSE French Team.
References
- Adamczak, J., Werner, K., Rauch, T., et al. 2012, A&A, 546, A1 [NASA ADS] [CrossRef] [EDP Sciences] [Google Scholar]
- Althaus, L. G., Panei, J. A., Miller Bertolami, M. M., et al. 2009, ApJ, 704, 1605 [NASA ADS] [CrossRef] [Google Scholar]
- Anderson, L. S. 1989, ApJ, 339, 558 [NASA ADS] [CrossRef] [Google Scholar]
- Asplund, M., Grevesse, N., Sauval, A. J., & Scott, P. 2009, ARA&A, 47, 481 [NASA ADS] [CrossRef] [Google Scholar]
- Bashkin, S., & Stoner, J. O. 1975, Atomic energy levels and Grotrian Diagrams – Vol. 1: Hydrogen I – Phosphorus XV; Vol. 2: Sulfur I – Titanium XXII (Amsterdam: North Holland Publishing Co.) [Google Scholar]
- Basile, J., & Holberg, J. B. 1985, BAAS, 17, 838 [NASA ADS] [Google Scholar]
- Córsico, A. H., Althaus, L. G., Kepler, S. O., Costa, J. E. S., & Miller Bertolami, M. M. 2008, A&A, 478, 869 [NASA ADS] [CrossRef] [EDP Sciences] [Google Scholar]
- Córsico, A. H., Althaus, L. G., Miller Bertolami, M. M., & García-Berro, E. 2009, A&A, 499, 257 [NASA ADS] [CrossRef] [EDP Sciences] [Google Scholar]
- Debes, J. H., Hoard, D. W., Wachter, S., Leisawitz, D. T., & Cohen, M. 2011, ApJS, 197, 38 [NASA ADS] [CrossRef] [Google Scholar]
- Dere, K. P., Landi, E., Mason, H. E., Monsignori Fossi, B. C., & Young, P. R. 1997, A&AS, 125, 149 [NASA ADS] [CrossRef] [EDP Sciences] [Google Scholar]
- Dreizler, S., & Heber, U. 1998, A&A, 334, 618 [NASA ADS] [Google Scholar]
- Grauer, A. D., Bond, H. E., Liebert, J., Fleming, T. A., & Green, R. F. 1987, ApJ, 323, 271 [NASA ADS] [CrossRef] [Google Scholar]
- Green, R. F., Schmidt, M., & Liebert, J. 1986, ApJS, 61, 305 [NASA ADS] [CrossRef] [Google Scholar]
- Hébrard, G., & Moos, H. W. 2003, ApJ, 599, 297 [NASA ADS] [CrossRef] [Google Scholar]
- Hébrard, G., Friedman, S. D., Kruk, J. W., et al. 2002, Planet. Space Sci., 50, 1169 [NASA ADS] [CrossRef] [Google Scholar]
- Hegazy, H., Büscher, S., Kunze, H.-J., & Wrubel, T. 1997, J. Quant. Spectr. Rad. Transf., 58, 627 [NASA ADS] [CrossRef] [Google Scholar]
- Herwig, F. 2000, A&A, 360, 952 [NASA ADS] [Google Scholar]
- Herwig, F., Blöcker, T., Langer, N., & Driebe, T. 1999, A&A, 349, L5 [NASA ADS] [Google Scholar]
- Jacoby, G. H., & van de Steene, G. 1995, AJ, 110, 1285 [NASA ADS] [CrossRef] [Google Scholar]
- Jahn, D., Rauch, T., Reiff, E., et al. 2007, A&A, 462, 281 [NASA ADS] [CrossRef] [EDP Sciences] [Google Scholar]
- Kurucz, R. L. 1991, in NATO ASIC Proc. 341: Stellar Atmospheres – Beyond Classical Models, eds. L. Crivellari, I. Hubeny, & D. G. Hummer, 441 [Google Scholar]
- Kurucz, R. L. 2009, in AIP Conf. Ser. 1171, eds. I. Hubeny, J. M. Stone, K. MacGregor, & K. Werner, 43 [Google Scholar]
- Kurucz, R. L. 2011, Canad. J. Phys., 89, 417 [NASA ADS] [CrossRef] [Google Scholar]
- Landi, E., Young, P. R., Dere, K. P., Del Zanna, G., & Mason, H. E. 2013, ApJ, 763, 86 [NASA ADS] [CrossRef] [Google Scholar]
- Miksa, S., Deetjen, J. L., Dreizler, S., et al. 2002, A&A, 389, 953 [NASA ADS] [CrossRef] [EDP Sciences] [Google Scholar]
- Miller Bertolami, M. M. 2016, A&A, 588, A25 [NASA ADS] [CrossRef] [EDP Sciences] [Google Scholar]
- Rauch, T., & Deetjen, J. L. 2003, in Stellar Atmosphere Modeling, eds. I. Hubeny, D. Mihalas, & K. Werner, ASP Conf. Ser., 288, 103 [Google Scholar]
- Reiff, E., Jahn, D., Rauch, T., et al. 2007, in 15th European Workshop on White Dwarfs, eds. R. Napiwotzki, & M. R. Burleigh, ASP Conf. Ser., 372, 237 [Google Scholar]
- Seaton, M. J., Yan, Y., Mihalas, D., & Pradhan, A. K. 1994, MNRAS, 266, 805 [NASA ADS] [CrossRef] [Google Scholar]
- Shingles, L. J., & Karakas, A. I. 2013, MNRAS, 431, 2861 [NASA ADS] [CrossRef] [Google Scholar]
- Weidemann, V. 2000, A&A, 363, 647 [NASA ADS] [Google Scholar]
- Werner, K., & Dreizler, S. 1999, J. Comput. Appl. Math., 109, 65 [NASA ADS] [CrossRef] [Google Scholar]
- Werner, K., & Heber, U. 1991, A&A, 247, 476 [NASA ADS] [Google Scholar]
- Werner, K., & Herwig, F. 2006, PASP, 118, 183 [NASA ADS] [CrossRef] [Google Scholar]
- Werner, K., & Rauch, T. 2014, A&A, 569, A99 [NASA ADS] [CrossRef] [EDP Sciences] [Google Scholar]
- Werner, K., & Rauch, T. 2015, A&A, 584, A19 [NASA ADS] [CrossRef] [EDP Sciences] [Google Scholar]
- Werner, K., Heber, U., & Hunger, K. 1991, A&A, 244, 437 [NASA ADS] [Google Scholar]
- Werner, K., Dreizler, S., Heber, U., et al. 1996, A&A, 307, 860 [NASA ADS] [Google Scholar]
- Werner, K., Deetjen, J. L., Dreizler, S., et al. 2003, in Stellar Atmosphere Modeling, eds. I. Hubeny, D. Mihalas, & K. Werner, ASP Conf. Ser., 288, 31 [Google Scholar]
- Werner, K., Rauch, T., Reiff, E., Kruk, J. W., & Napiwotzki, R. 2004, A&A, 427, 685 [NASA ADS] [CrossRef] [EDP Sciences] [Google Scholar]
- Werner, K., Rauch, T., & Kruk, J. W. 2005, A&A, 433, 641 [NASA ADS] [CrossRef] [EDP Sciences] [Google Scholar]
- Werner, K., Rauch, T., & Kruk, J. W. 2007a, A&A, 466, 317 [NASA ADS] [CrossRef] [EDP Sciences] [Google Scholar]
- Werner, K., Rauch, T., & Kruk, J. W. 2007b, A&A, 474, 591 [NASA ADS] [CrossRef] [EDP Sciences] [Google Scholar]
- Werner, K., Rauch, T., & Kruk, J. W. 2010, ApJ, 719, L32 [NASA ADS] [CrossRef] [Google Scholar]
- Werner, K., Rauch, T., Kruk, J. W., & Kurucz, R. L. 2011, A&A, 531, A146 [NASA ADS] [CrossRef] [EDP Sciences] [Google Scholar]
- Werner, K., Rauch, T., & Kepler, S. O. 2014, A&A, 564, A53 [NASA ADS] [CrossRef] [EDP Sciences] [Google Scholar]
- Werner, K., Rauch, T., & Kruk, J. W. 2015, A&A, 582, A94 [NASA ADS] [CrossRef] [EDP Sciences] [Google Scholar]
- Wesemael, F., Green, R. F., & Liebert, J. 1985, ApJS, 58, 379 [Google Scholar]
All Tables
Number of non-LTE levels and lines of model ions used for line formation calculations of metals.
Asteroseismic, spectroscopic, and initial masses of the five considered PG 1159 stars.
All Figures
|
Fig. 1 FUSE spectrum of PG 1520+525 (thin black line) compared to a photospheric model spectrum (thick red line) with the finally adopted parameters as listed in Table 1. Prominent photospheric spectral lines are identified. Uncertain identifications are given in brackets. Unidentified, probably photospheric, lines are indicated by question marks. Geocoronal emission in the center of Lyman β was cut out. Overplotted in blue is the same model including ISM lines. |
| In the text | |
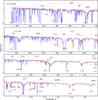 |
Fig. 2 As Fig. 1, for PG 1144+005. |
| In the text | |
|
Fig. 3 Element abundances measured in five PG 1159 stars. Upper limits are indicated by arrows. Data for our two program stars and PG 1159−035 are from Table 1. Data for PG 1707+427 and PG 1424+535 are from Werner et al. (2015) except for the H abundances (from Werner et al. 1991). The black solid line indicates solar abundances. |
| In the text | |
|
Fig. 4 Model fits to the S vi resonance doublet in the two program stars and in the prototype PG 1159−035, with parameters as given in Table 1. In PG 1144+005 and PG 1520+525, the 933.38 Å component is blended by an interstellar H2 line. Red curves: pure photospheric spectrum. Blue curves: ISM lines included in the model (not for PG 1159−035). |
| In the text | |
Current usage metrics show cumulative count of Article Views (full-text article views including HTML views, PDF and ePub downloads, according to the available data) and Abstracts Views on Vision4Press platform.
Data correspond to usage on the plateform after 2015. The current usage metrics is available 48-96 hours after online publication and is updated daily on week days.
Initial download of the metrics may take a while.