| Issue |
A&A
Volume 593, September 2016
|
|
|---|---|---|
| Article Number | L4 | |
| Number of page(s) | 5 | |
| Section | Letters | |
| DOI | https://doi.org/10.1051/0004-6361/201628876 | |
| Published online | 06 September 2016 | |
First image of the L1157 molecular jet by the CALYPSO IRAM-PdBI survey
1 INAF-Osservatorio
Astrofisico di Arcetri, Largo E. Fermi 5, 50125
Firenze,
Italy
e-mail: This email address is being protected from spambots. You need JavaScript enabled to view it.
2 IRAM, 300 rue de la Piscine, 38406
Saint Martin d’ Hères,
France
3 LERMA, Observatoire de Paris, PSL
Research University, CNRS, UMR 8112, 75014
Paris,
France
4 Univ. Grenoble Alpes, IPAG,
38000
Grenoble,
France
5 CNRS, IPAG, 38000
Grenoble,
France
6 Laboratoire AIM-Paris-Saclay,
CEA/DSM/Irfu – CNRS – Université Paris Diderot, Saclay, 91191
Gif-sur-Yvette,
France
7 Max-Planck-Institut für
Radioastronomie, Auf dem Hügel
69, 53121
Bonn,
Germany
8 OASU/LAB-UMR 5804, CNRS, Université
Bordeaux 1, 33270
Floirac,
France
9 ESO, Karl-Schwarzschild-Strasse 2,
85748
Garching bei München,
Germany
Received:
8
May
2016
Accepted:
8
August
2016
Abstract
Context. Fast jets are thought to be a crucial ingredient of star formation because they might extract angular momentum from the disk and thus allow mass accretion onto the star. However, it is unclear whether jets are ubiquitous, and likewise, their contribution to mass and angular momentum extraction during protostar formation remains an open question.
Aims. Our aim is to investigate the ejection process in the low-mass Class 0 protostar L1157. This source is associated with a spectacular bipolar outflow, and the recent detection of high-velocity SiO suggests the occurrence of a jet.
Methods. Observations of CO 2
−1 and SiO 5 −
4 at ~ resolution were obtained with the IRAM Plateau de Bure
Interferometer (PdBI) as part of the CALYPSO large program. The jet and outflow structure
were fit with a precession model. We derived the column density of CO and SiO, as well as
the jet mass-loss rate and mechanical luminosity.
resolution were obtained with the IRAM Plateau de Bure
Interferometer (PdBI) as part of the CALYPSO large program. The jet and outflow structure
were fit with a precession model. We derived the column density of CO and SiO, as well as
the jet mass-loss rate and mechanical luminosity.
Results. High-velocity CO and SiO emission resolve for the first time the first 200 au of the outflow-driving molecular jet. The jet is strongly asymmetric, with the blue lobe ~0.65 times slower than the red lobe. This suggests that the large-scale asymmetry of the outflow is directly linked to the jet velocity and that the asymmetry in the launching mechanism has been at work for the past 1800 yr. Velocity asymmetries are common in T Tauri stars, which suggests that the jet formation mechanism from Class 0 to Class II stages might be similar. Our model simultaneously fits the properties of the inner jet and of the clumpy 0.2 pc scale outflow by assuming that the jet precesses counter-clockwise on a cone inclined by 73° to the line of sight with an opening angle of 8° on a period of ~1640 yr. The estimated jet mass flux and mechanical luminosity are Ṁjet ~ 7.7 × 10⁻⁷M⊙ yr-1 and Ljet ~ 0.9L⊙, indicating that the jet could extract at least 25% of the gravitational energy released by the forming star.
Key words: stars: formation / circumstellar matter / ISM: jets and outflows / ISM: molecules
© ESO, 2016
1. Introduction
Young Class 0 protostars (t< 105 yr) are representative of the main accretion phase, during which most of the final stellar mass is accreted from the dense parental envelope onto the central protostellar embryo (André et al. 2000). During this phase, the gas in the protostellar envelope must reduce its specific angular momentum by 5 orders of magnitude to allow the star to form without reaching its break-up speed. Early theoretical studies (e.g., Pudritz & Norman 1986) suggested that this angular momentum problem might be solved thanks to the ejection of magneto-centrifugal jets, which transport away angular momentum.
Fast and collimated molecular jets as well as slower wide-angle outflows, which are thought to be produced by the ambient gas entrained and accelerated by the ejected material, are frequently observed at the earliest protostellar stage (e.g., Arce et al. 2007). However, several aspects are still unclear, for instance, the amount of accretion energy and angular momentum that the jet extracts from the system and the fraction of time for which they are active. Most importantly, it is not clear whether jets are truly universal or only present in the most powerful outflow sources.
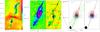 |
Fig. 1 Left panel: Spitzer/IRAC 8 μm observations of the L1157 outflow (Looney et al. 2007; Takami et al. 2011). The resolution is ~ |


A particularly interesting target in which to investigate the role of jets at the early protostellar stage is the low-mass Class 0 source L1157-mm, located at d≃ 250 pc (Looney et al. 2007). The protostar is associated with a spectacular bipolar outflow that has been the subject of a large number of observational campaigns. These studies have shown a number of indirect pieces of evidence of a jet driven by the L1157-mm: (i) a chain of curved bow shocks in NH3, SiO, H2, indicating the action of a precessing time-variable jet (Tafalla & Bachiller 1995; Zhang et al. 1995; Gueth et al. 1998; Takami et al. 2011); (ii) elongated CO cavities trailing behind these bright shocks, suggestive of jet-driven entrainment in the bow wings (Gueth et al. 1996); (iii) and a compact dissociative shock in [O i] 63 μm behind the tip of the brightest bow shock B1, consistent with a jet Mach disk with momentum flux sufficient to drive the large-scale CO outflow (Benedettini et al. 2012). Different scenarios have been proposed to explain how such a jet can produce the morphology and kinematics of the spectacular parsec-scale outflow. Gueth et al. (1996) and Bachiller et al. (2001) suggested that the observed outflow cavities are opened by a jet precessing on the surface of a cone with a period of about 4000−5000 yr. Kwon et al. (2015) proposed instead that the curved CO structures are not tracing swept-up cavities but a pair of precessing, misaligned jets. However, so far no jet was imaged close to the source in mm/sub-mm interferometric maps. Only very recently, Tafalla et al. (2015) reported the detection of SiO high-velocity emission by using single-dish IRAM-30 m observations, supporting the occurrence of a jet in the inner 11″ around L1157-mm.
In this Letter we report the first images of the L1157 jet, using SiO and CO emission, in the framework of the IRAM Plateau de Bure Interferometer (PdBI) large program continuum and lines in young protostellar objects (CALYPSO)1. The presented observations allow us to derive the jet properties and its interplay with the large-scale outflow.
2. Observations and data reduction
The central 20″ region toward the L1157-mm protostar was observed with the IRAM PdBI in February, March, and November 2011 using the A and C configurations. The shortest baseline is ~20 m and the longest is ~760 m, allowing us to recover emission at scales from ~8″ to ~ at 1.3 mm. The SiO 5−4 and CO 2−1 lines at 217 104.98 and 230 538.00 MHz were observed using the WideX backend, which covers a 4 GHz spectral window with a spectral resolution of ~2 MHz, which is ~3.2−3.4 km s-1 at the considered wavelengths. The calibration was carried out with GILDAS-CLIC2 following standard procedures. The phase rms was ≤50° and ≤80° for the A and C tracks, respectively, the pwv was 0.5−1 mm (A) and ~1−2 mm (C), and the system temperature was ~100−160 K (A) and 150−250 K (C). The uncertainty on the absolute flux calibration is ≤15% and the typical rms noise per spectral resolution channel ~3−9 mJy/beam. Images were produced using robust weighting, resulting in a clean beam of ~ (PA = 0°) for SiO 5−4 and ~
 (PA = 12°) for CO 2−1.
3. Asymmetric molecular jet
Figure 1 shows in the left panel a H2Spitzer map of the L1157 outflow reported by Looney et al. (2007), in the middle panel IRAM-PdBI maps of the blueshifted outflow lobe in CO 1−0 and SiO 2−1 at ~3″ resolution (Gueth et al. 1996, 1998), and in the right panel a zoom-in on the central 1000 au around the protostar in CO 2−1 and SiO 5−4 at much higher resolution (~) obtained from our IRAM-PdBI CALYPSO observations. Both CO 2−1 and SiO 5−4 show compact emission at high blue- and redshifted velocities, probing a molecular jet. The high-velocity range (HV) is defined based on SiO 5−4, which solely shows emission at high velocities, that is, at 22 < | V − Vsys | < 57 km s-1 in the blue lobe and at 36 < | V − Vsys | < 63 km s-1 in the red lobe (the systemic velocity in the LSR is Vsys = + 2.7 km s-1, Bachiller & Pérez Gutiérrez 1997). CO 2−1 also shows low-velocity emission (LV) with an X-shaped pattern (with one arm of the X much brighter than the other), coinciding with the walls of the CO cavity shown on larger scale by Gueth et al. (1996). The HV compact emission is oriented roughly along the middle of this X, which suggests that the LV CO traces ambient material that is swept-up by a single precessing jet, as proposed by Gueth et al. (1996), and not two misaligned jets (see Kwon et al. 2015).
The HV CO 2−1 and SiO 5−4 emission reveals for the first time the base (~200 au) of the bipolar high-velocity jet driving the large-scale outflow, in agreement with what was recently suggested by Tafalla et al. (2015) based on spatially unresolved IRAM-30 m observations of the SiO 5−4 and 6−5 lines. The molecular jet consists of a blue- and a redshifted knot (named B′ and R′) located along PAjet ~ −17° with an emission peak at ~ and ~
and ~ distance from L1157-mm, respectively. The position velocity diagram of the CO 2−1 and SiO 5−4 emission extracted along the jet PA is shown in Fig. A.1. The jet width is estimated by a Gaussian fit of the CO intensity profile perpendicular to the jet axis (the jet is not resolved transversally in SiO because of the larger beam size). CO has a FWHM at the emission peak of ~
 in the redshifted knot and ~
 in the blueshifted knot. This corresponds to intrinsic widths of ~
 (i.e., ~60 au), and ~
 (i.e. ~125 au), respectively, after correcting for beam smearing (the effective resolution across the jet is
  , equivalent to the geometric mean of the beam major and minor axes). This indicates a strong jet asymmetry where the blueshifted knot is less collimated and less extended than the redshifted knot.
Moreover, the spectra of SiO 5−4 and CO 2−1 in knots B′ and R′ (Fig. 2) indicate that the blueshifted knot is spectrally broader and has a lower peak radial velocity (Vrad,b ~ −35 km s-1) than the redshifted knot (Vrad,r ~ + 55 km s-1). The observed jet asymmetry in velocity (Vrad,b/Vrad,r ~ 0.65) perfectly matches the asymmetry in length of the large-scale outflow (the precession model by Bachiller et al. 2001 assumes exactly the same velocity ratio to reproduce the different length of the blue and red outflow lobes). This indicates that the outflow asymmetry is directly linked to the jet velocity and is not due to a difference in the density of the interstellar medium (ISM). The agreement with the different global lengths of the north and south lobes suggests that the asymmetry in the launching mechanism has been at work since the ejection of the terminal knots (B2 and R2). Similar asymmetries are common in Class II sources (e.g., Hirth et al. 1994, 1997; Melnikov et al. 2009; Podio et al. 2011). In addition to the similarity in knot spacings and collimation between Class 0 and Class II jets (e.g., Cabrit et al. 2007; Podio et al. 2015), this is another hint that the jet launching mechanism in protostars of ~104 yr might be similar to that for Class II sources (~106 yr).
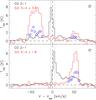 |
Fig. 2 Spectra of SiO 5−4 (red) and CO 2−1 (black), and their intensity ratios SiO 5−4/CO 2−1 (blue diamonds) at the position of the HV blue- (top) and redshifted (bottom) jet knots, B′ and R′. The profiles are normalized to the CO peak intensity (normalization factor is labeled). Horizonthal and vertical dashed lines mark the baseline and the systemic velocity, Vsys = + 2.7 km s-1 and the vertical dotted lines the ±5 km s-1 interval where extended CO emission is filtered out. |
4. Jet precession
Previous studies (e.g., Gueth et al. 1996; Bachiller et al. 2001) suggested that the spatial misalignment and slightly different radial velocities between the bright CO cavities in the blue and red lobes might be due to a jet slowly precessing on the surface of a cone inclined by an angle i to the line of sight (l.o.s.) with an opening angle θ on a period P. Ejection events occurring while the jet precesses produce knots that then propagate with velocity VS. However, as the jet has never been mapped before, the model parameters (i, θ, VS, precession sense, knot ages) were poorly constrained. The properties of the inner jet knots revealed by our IRAM-PdBI observations set strong constraints on the precession model first presented by Gueth et al. (1996) as we describe below.
-
(i)
The jet orientation near the protostar isPAjet ~ −17°. If the jet precesses, its orientation varies periodically around the PA of the precession cone (PAcone ~ −22° to reproduce the large-scale outflow precession pattern, Gueth et al. 1996) between PAcone − θ and PAcone + θ. The PA of the most recent and closest knots indicates that the precession axis currently is on the west side of the cone and that the opening angle should be θ ≥ 5°.
-
(ii)
The jet radial velocity in the inner knot B′, ~−35 km s-1, is higher than in knot B1 (~−15 ± 5 km s-1, Zhang et al. 1995; Gueth et al. 1998; Gómez-Ruiz et al. 2013). Here, it is assumed that the HV SiO emission in B1 probes the jet impact region and not entrained material. This assumption is based on the fact that, while LV SiO has a bow-shock structure, the HV SiO (~−8 /−18 km s-1) is confined to a compact region (Gueth et al. 1998). If the jet precesses and propagates with constant speed then the inclination with respect to l.o.s, ijet, varies periodically between i − θ and i + θ, as does the velocity projection along the l.o.s. (Vrad). In this scenario, Vrad(B′) >Vrad(B1) implies that the inclination at the time the knot B′ was ejected was smaller than for B1 (Vrad(B′) /Vrad(B1) = cos ijet(B′) / cos ijet(B1)), meaning that the knots B′ and B1 were ejected when the precession axis was at the front and the back side of the precession cone, respectively. This strongly constrains the inclination of the cone i and the time of knot ejection.
-
(iii)
The spectra of the inner knots, B′ and R′, indicate that the blueshifted jet travels at a speed ~0.65 times lower than the redshifted jet (Vjet,b = 0.65Vjet,r).
To satisfy these constraints and reproduce the positions of knots B1 and B2 (Gueth et al. 1996), as well as the precession pattern in the northern lobe visible in the Spitzer map (Looney et al. 2007), we assume that the jet axis is precessing on a cone inclined by i = 73° with opening angle θ = 8°, that the precession axis was at the front side of the cone at the time B2 was ejected (ijet(B2) = 65°) and precesses counter-clockwise (looking down from north), that the jet propagates with a constant speed VS, and that the ages of knots B2, B1, B0, and B′ in the blue lobe (and the corresponding knots R2, R1, R0, and R′ in the red lobe) relative to the period P are 1.1 × P, ~0.67 × P, ~0.58 × P, and ~0.002 × P (which correspond to inclination angles of 65°, 80.2°, 81°, and 66.4°). As shown in Fig. 1, our precession model simultaneously fits the large-scale outflow (IRAM-PdBI CO and SiO maps by Gueth et al. 1996, 1998 and H2Spitzer map by Looney et al. 2007) and the inner jet structure (i.e., the HV knots B′ and R′).
If the jet precession is due to disk precession induced by tidal interaction with a companion in a non-coplanar orbit, then the jet should precess in the opposite direction to the rotation of the disk (retrograde precession). This scenario is supported by C18O observations by Kwon et al. (2015), which indicate that the inner flattened envelope rotates clockwise. Moreover, the modeling of PdBI visibilities from the 1.3 mm continuum emission suggests a ± 70 mJy secondary source at < from L1157-mm (Maury et al., in prep.).
5. Jet properties
By correcting the observed radial velocities and tangential distances for the knot inclination angles, we derive the jet velocity, the distance and age of the knots, and the jet mass-loss rate and mechanical luminosity. The derived jet properties rely on the inclination of the precession cone inferred from the model (i = 73°), which in turn depends on the ratio of the jet radial velocities in knots B′ and B1. If the jet radial velocity at B1 is higher than what is inferred from SiO, for example, because of gas slow-down in the reverse shock, the inclination angle is smaller (e.g., i ~ 60° for Vrad(B1) = −23 km s-1), implying a jet velocity lower by ~30%. The small spatial overlap of the red and blue jet lobes close to the source and the flattened envelope in the Spitzer maps (Fig. 1) indicate, however, that the jet lies close to the plane of the sky, favoring large inclination angles. Therefore, we adopt i = 73°. The deprojected velocities and distances of the inner knots B′ and R′ are Vjet,b ~ 87 km s-1, Vjet,r ~ 137 km s-1, and d(B′) ~ 60 au, d(R′) ~ 166 au. If the B2 shock, located at a deprojected distance d(B2) ~ 130″, propagates with a velocity VS = Vjet,b = 87 km s-1, then its dynamical timescale is τ(B2) = d(B2) /Vjet,b ~ 1800 yr. This implies that the precession period is P ~ 1640 yr and the dynamical age of B1 /R1, B0 /R0, and B′/R′ is ~1100, ~950, and ~4 yr. The inferred knot ages are ~0.6 times younger than previously estimated by Gueth et al. (1996), mainly because of the assumed distance (250 pc instead of 440 pc).
The beam-averaged column densities of CO and SiO in the jet, NCO and NSiO, are derived from CO 2−1 and SiO 5−4 HV emission in knots B′ and R′ by assuming optically thin local thermodynamic equilibrium (LTE) emission at temperature TK ~ Tex = 40 ± 30 K (Tafalla et al. 2015). The ratio of SiO 5−4 to CO 2−1 in the HV range is ~2 in the blue and red lobe, indicating similar SiO abundances (see Fig. 2). We obtain  cm-2 in the blue and red knot and
 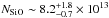 cm-2 in B′ and ~
 cm-2 in R′ (the uncertainty on NCO and NSiO is due to the assumed Tex). The abundance of SiO is derived as XSiO = XCO × NSiO/NCO, where XCO ~ 10-4 is the CO abundance with respect to H2. We find XSiO ~ 3 × 10⁻⁷ in the inner jet knots.
Then, the mass-loss rate of the molecular jet is calculated as Ṁjet = mH2 × (NCO/XCO) × HPBWtr × Vjet, where Vjet is the deprojected jet velocity, HPBWtr is the beam size across the jet (~ ). We find
  and
and  M⊙ yr-1. The inferred value for the blueshifted jet agrees with the estimate derived from the [O i] 63μm luminosity in the B1 knot (~2 × 10⁻⁷M⊙ yr-1, Benedettini et al. 2012).
The determination of the jet speed and mass-loss rate allows us to estimate the jet mechanical luminosity, that is,  . We obtain Ljet,b = 0.2 ± 0.1L⊙ and Ljet,r = 0.7 ± 0.2L⊙. The total jet power is ~0.9L⊙, which is about one-fourth of the source bolometric luminosity (~3.6L⊙ at d = 250 pc, Green et al. 2013). This indicates that at least 25% of the gravitational energy released by accretion onto the protostar could be extracted and converted into mechanical form in the jet.
Finally, an estimate of the outflow age, τout, can be derived by imposing that the momentum deposited by the jet in the blue lobe Pjet = Ṁjet × Vjet × τout is equal to the CO outflow momentum, that is, Pout = MCO × VCO. The outflow momentum in the blue lobe, corrected for the assumed distance of 250 pc, is Pout = 0.94M⊙ km s-1 (Bachiller et al. 2001). As Ṁjet,b = 3.0 × 10⁻⁷M⊙ yr-1 and Vjet,b = 87 km s-1 in the blueshifted jet, the outflow age is τout ~ 3 × 10⁴ yr, in agreement with the lifetime of Class 0 sources (~4−9 × 10⁴ yr, see, e.g., Evans et al. 2009; Maury et al. 2011). The estimated outflow age is much older than the dynamical timescale of knot B2 inferred from our precession model (~1800 yr). The reason might be that the jet suddenly slows down when it encounters much denser ambient gas in the farthest knots (B2 and R2), so that the CO outflow takes about 3 × 10⁴ yr to reach its current total length. In this scenario only jet material ejected during the past 1800 yr is visible in the CO cavity, while older ejecta have piled up at the tip of the CO outflow or against the cavity walls intercepted by the precessing jet (e.g., near B1). Alternatively, the discrepancy between τout and τ(B2) might arise from older working surfaces that have moved far away from the source (~2.7 pc, i.e., 36′, in 3 × 10⁴ yr at 87 km s-1) so that their CO counterparts have not been observed because of the limited mapping area, fainter CO emission and less efficient jet-entrainment at lower density, and increased confusion with static ambient cloud emission.
6. Conclusions
Our CALYPSO PdBI observations reveal for the first time the first 200 au of the fast and collimated (~60−125 au) molecular jet driving the L1157 outflow. The observations indicate that the large-scale asymmetry in length of the molecular outflow is directly linked to an asymmetry in the jet velocity (the blue lobe is ~0.65 times slower then the red lobe). This also implies that the asymmetry in the launching mechanism has been at work for the past 1800 yr. The velocity asymmetry is similar to that frequently observed in Class II jets, suggesting that the same ejection process is at work throughout the star formation process from Class 0 to Class II sources. Our model indicates that the clumpy large-scale outflow extending up to 0.2 pc might be driven by a jet precessing on the surface of a cone inclined by 73° to the l.o.s with an opening angle θ = 8° on a period P ~ 1640 yr. The precession is retrograde with respect to the envelope rotation, which favors tidal disk precession due to a non-coplanar companion. The jet mass loss-rate is ~7.7 × 10⁻⁷M⊙ yr-1 and the mechanical luminosity is ~0.9L⊙, indicating that at least 25% of the gravitational energy released by the forming protostar might be dissipated by the jet.
Acknowledgments
L.P. has received funding from the European Union FP7, GA No. 267251. The CALYPSO project has received further support from the European Union’s FP7 (ERC Advanced GA No. 291294 − “ORISTARS”).
References
- André, P., Ward-Thompson, D., & Barsony, M. 2000, Protostars and Planets IV, 59 [Google Scholar]
- Arce, H. G., Shepherd, D., Gueth, F., et al. 2007, Protostars and Planets V, 245 [Google Scholar]
- Bachiller, R., & Pérez Gutiérrez, M. 1997, ApJ, 487, L93 [NASA ADS] [CrossRef] [Google Scholar]
- Bachiller, R., Pérez Gutiérrez, M., Kumar, M. S. N., & Tafalla, M. 2001, A&A, 372, 899 [NASA ADS] [CrossRef] [EDP Sciences] [Google Scholar]
- Benedettini, M., Busquet, G., Lefloch, B., et al. 2012, A&A, 539, L3 [NASA ADS] [CrossRef] [EDP Sciences] [Google Scholar]
- Cabrit, S., Codella, C., Gueth, F., et al. 2007, A&A, 468, L29 [NASA ADS] [CrossRef] [EDP Sciences] [Google Scholar]
- Evans, II, N. J., Dunham, M. M., Jørgensen, J. K., et al. 2009, ApJS, 181, 321 [NASA ADS] [CrossRef] [Google Scholar]
- Gómez-Ruiz, A. I., Hirano, N., Leurini, S., & Liu, S.-Y. 2013, A&A, 558, A94 [NASA ADS] [CrossRef] [EDP Sciences] [Google Scholar]
- Green, J. D., Evans, II, N. J., Jørgensen, J. K., et al. 2013, ApJ, 770, 123 [NASA ADS] [CrossRef] [Google Scholar]
- Gueth, F., Guilloteau, S., & Bachiller, R. 1996, A&A, 307, 891 [NASA ADS] [Google Scholar]
- Gueth, F., Guilloteau, S., & Bachiller, R. 1998, A&A, 333, 287 [NASA ADS] [Google Scholar]
- Hirth, G. A., Mundt, R., Solf, J., & Ray, T. P. 1994, ApJ, 427, L99 [NASA ADS] [CrossRef] [Google Scholar]
- Hirth, G. A., Mundt, R., & Solf, J. 1997, A&AS, 126, 437 [NASA ADS] [CrossRef] [EDP Sciences] [Google Scholar]
- Kwon, W., Fernández-López, M., Stephens, I. W., & Looney, L. W. 2015, ApJ, 814, 43 [NASA ADS] [CrossRef] [Google Scholar]
- Looney, L. W., Tobin, J. J., & Kwon, W. 2007, ApJ, 670, L131 [NASA ADS] [CrossRef] [Google Scholar]
- Maury, A. J., André, P., Men’shchikov, A., Könyves, V., & Bontemps, S. 2011, A&A, 535, A77 [Google Scholar]
- Melnikov, S. Y., Eislöffel, J., Bacciotti, F., Woitas, J., & Ray, T. P. 2009, A&A, 506, 763 [NASA ADS] [CrossRef] [EDP Sciences] [Google Scholar]
- Podio, L., Eislöffel, J., Melnikov, S., Hodapp, K. W., & Bacciotti, F. 2011, A&A, 527, A13 [NASA ADS] [CrossRef] [EDP Sciences] [Google Scholar]
- Podio, L., Codella, C., Gueth, F., et al. 2015, A&A, 581, A85 [NASA ADS] [CrossRef] [EDP Sciences] [Google Scholar]
- Pudritz, R. E., & Norman, C. A. 1986, ApJ, 301, 571 [NASA ADS] [CrossRef] [Google Scholar]
- Tafalla, M., & Bachiller, R. 1995, ApJ, 443, L37 [Google Scholar]
- Tafalla, M., Bachiller, R., Lefloch, B., et al. 2015, A&A, 573, L2 [NASA ADS] [CrossRef] [EDP Sciences] [Google Scholar]
- Takami, M., Karr, J. L., Nisini, B., & Ray, T. P. 2011, ApJ, 743, 193 [NASA ADS] [CrossRef] [Google Scholar]
- Zhang, Q., Ho, P. T. P., Wright, M. C. H., & Wilner, D. J. 1995, ApJ, 451, L71 [NASA ADS] [CrossRef] [Google Scholar]
Appendix A: Position-velocity diagrams
The position velocity diagram of the CO 2−1 and SiO 5−4 emission extracted along the jet PA (PAjet − 17°) is shown in Fig. A.1. The figure shows that the CO and SiO emission probe the same jet component at HV, that is, a compact and collimated jet close to the protostar.
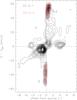 |
Fig. A.1 Position-velocity diagram of CO 2−1 (black contours) and SiO 5−4 (gray-scale and red contours) along the PA of the high-velocity molecular jet (PAjet ~ −17°). Horizontal and vertical dashed lines mark the systemic velocity, Vsys = + 2.7 km s-1, and the continuum peak. The first contour is at 5σ with steps of 3σ. |
All Figures
|
Fig. 1 Left panel: Spitzer/IRAC 8 μm observations of the L1157 outflow (Looney et al. 2007; Takami et al. 2011). The resolution is ~ |
| In the text | |
|
Fig. 2 Spectra of SiO 5−4 (red) and CO 2−1 (black), and their intensity ratios SiO 5−4/CO 2−1 (blue diamonds) at the position of the HV blue- (top) and redshifted (bottom) jet knots, B′ and R′. The profiles are normalized to the CO peak intensity (normalization factor is labeled). Horizonthal and vertical dashed lines mark the baseline and the systemic velocity, Vsys = + 2.7 km s-1 and the vertical dotted lines the ±5 km s-1 interval where extended CO emission is filtered out. |
| In the text | |
|
Fig. A.1 Position-velocity diagram of CO 2−1 (black contours) and SiO 5−4 (gray-scale and red contours) along the PA of the high-velocity molecular jet (PAjet ~ −17°). Horizontal and vertical dashed lines mark the systemic velocity, Vsys = + 2.7 km s-1, and the continuum peak. The first contour is at 5σ with steps of 3σ. |
| In the text | |
Current usage metrics show cumulative count of Article Views (full-text article views including HTML views, PDF and ePub downloads, according to the available data) and Abstracts Views on Vision4Press platform.
Data correspond to usage on the plateform after 2015. The current usage metrics is available 48-96 hours after online publication and is updated daily on week days.
Initial download of the metrics may take a while.