Fig. 1
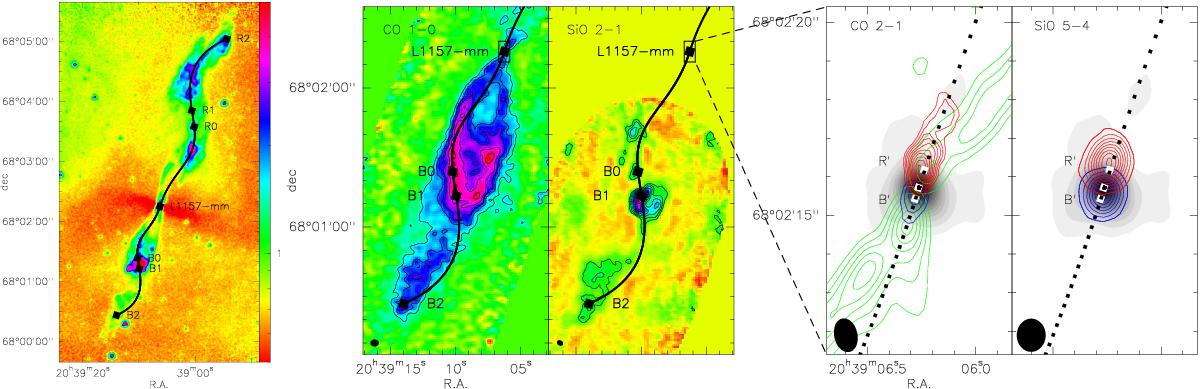
Left panel: Spitzer/IRAC 8 μm observations of the L1157 outflow (Looney et al. 2007; Takami et al. 2011). The resolution is ~![]() and the intensity color scale is logarithmic from 0.05 to 5 mJy/sr. The precession model (black line) is overplotted. Middle panels: the precession model (black line) is overplotted on integrated CO 1−0 and SiO 2−1 maps of the L1157 outflow by Gueth et al. (1996, 1998; IRAM-30 m + PdBI data, | V − Vsys | = 0−11 km s-1 for CO and 0−18 km s-1 for SiO, HPBW:
and the intensity color scale is logarithmic from 0.05 to 5 mJy/sr. The precession model (black line) is overplotted. Middle panels: the precession model (black line) is overplotted on integrated CO 1−0 and SiO 2−1 maps of the L1157 outflow by Gueth et al. (1996, 1998; IRAM-30 m + PdBI data, | V − Vsys | = 0−11 km s-1 for CO and 0−18 km s-1 for SiO, HPBW: ![]() , PA = 90° for CO,
, PA = 90° for CO, ![]() , PA = 56° for SiO). The first contour is at 5σ with steps of 3σ (1σ = 0.5 Jy km s-1/beam for CO, and 0.2 Jy km s-1/beam for SiO). The black squares indicate the driving source, L1157-mm, and the blueshifted knots. Right panels: zoom-in on the inner jet revealed by CO 2−1 and SiO 5−4 maps obtained with IRAM-PdBI as part of CALYPSO. The emission is integrated over high blue- and redshifted velocities (in | V − Vsys |) (blue/red contours) (HVb = 22−57 km s-1, HVr = 36−63 km s-1). CO 2−1 also shows emission at low velocities (green contours; LVb< 22 km s-1, LVr< 36 km s-1) . The gray-scale traces the continuum emission at 1.3 mm. The white squares indicate the continuum peak and the inner HV knots B′ and R′. The ellipse in the bottom left corner shows the beam HPBW (
, PA = 56° for SiO). The first contour is at 5σ with steps of 3σ (1σ = 0.5 Jy km s-1/beam for CO, and 0.2 Jy km s-1/beam for SiO). The black squares indicate the driving source, L1157-mm, and the blueshifted knots. Right panels: zoom-in on the inner jet revealed by CO 2−1 and SiO 5−4 maps obtained with IRAM-PdBI as part of CALYPSO. The emission is integrated over high blue- and redshifted velocities (in | V − Vsys |) (blue/red contours) (HVb = 22−57 km s-1, HVr = 36−63 km s-1). CO 2−1 also shows emission at low velocities (green contours; LVb< 22 km s-1, LVr< 36 km s-1) . The gray-scale traces the continuum emission at 1.3 mm. The white squares indicate the continuum peak and the inner HV knots B′ and R′. The ellipse in the bottom left corner shows the beam HPBW (![]() , PA = 12° for CO,
, PA = 12° for CO, ![]() , PA = 0° for SiO). The first contour is at 5σ with steps of 3σ (1σ ~ 1.3 mJy/beam for continuum, and ~50, 70, 180 mJy km s-1/beam for SiO, CO HV, and CO LV, respectively). The precession is plotted in steps of 0.0025 × P, i.e., ~4.1 yr, where P = 1640 yr is the precession period (black squares).
, PA = 0° for SiO). The first contour is at 5σ with steps of 3σ (1σ ~ 1.3 mJy/beam for continuum, and ~50, 70, 180 mJy km s-1/beam for SiO, CO HV, and CO LV, respectively). The precession is plotted in steps of 0.0025 × P, i.e., ~4.1 yr, where P = 1640 yr is the precession period (black squares).
Current usage metrics show cumulative count of Article Views (full-text article views including HTML views, PDF and ePub downloads, according to the available data) and Abstracts Views on Vision4Press platform.
Data correspond to usage on the plateform after 2015. The current usage metrics is available 48-96 hours after online publication and is updated daily on week days.
Initial download of the metrics may take a while.