Fig. 5
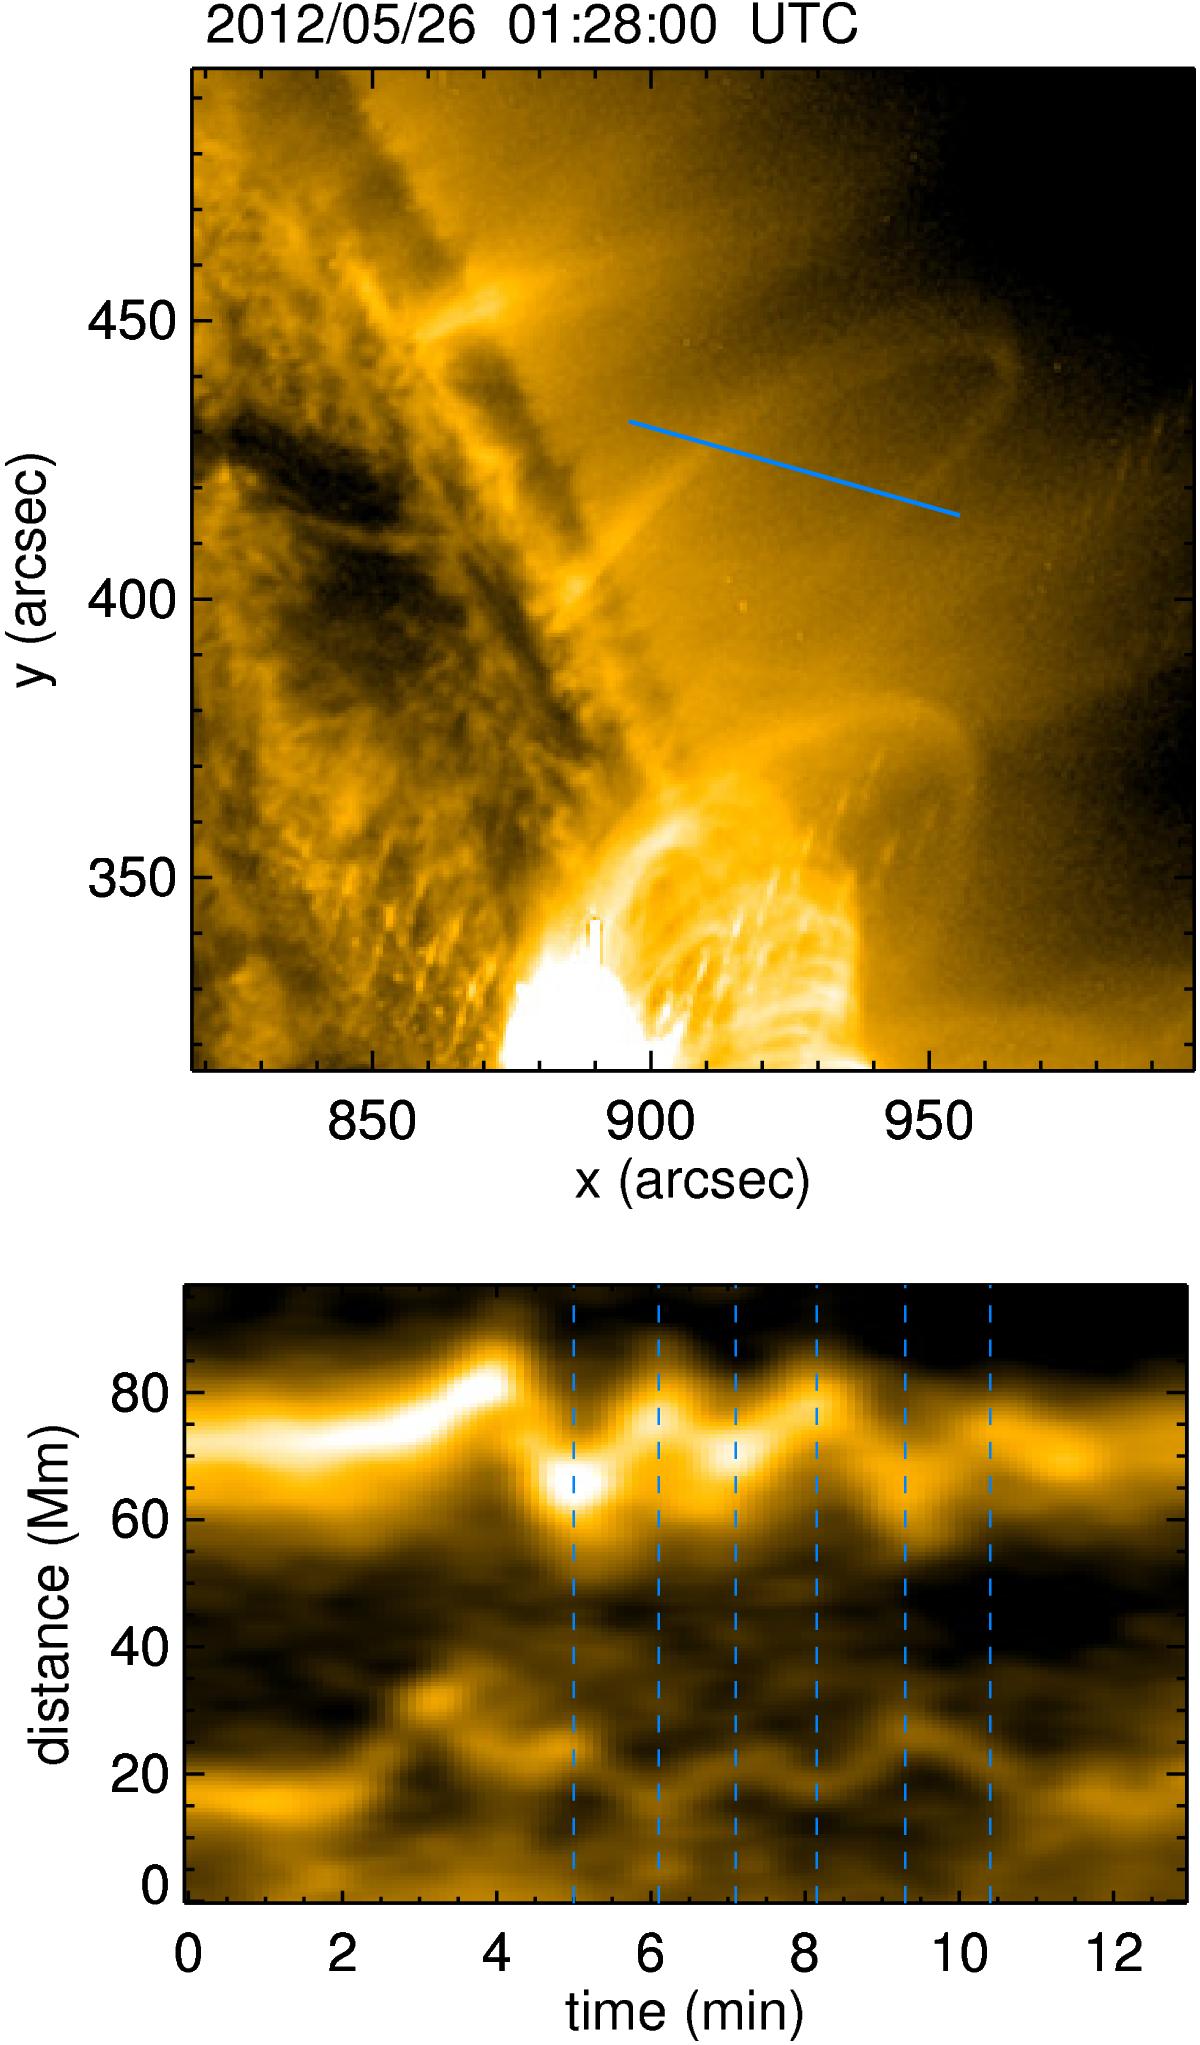
Demonstration of the anti-phase motion of the loop legs due to the second harmonic standing kink mode. The top panel shows the slit (solid blue line) used to create the TD map shown in the bottom panel. The slit is taken near the location of the anti-nodes of the second harmonic. The vertical dashed lines denote the times of the extrema in the TD map. See also the associated movie.
Current usage metrics show cumulative count of Article Views (full-text article views including HTML views, PDF and ePub downloads, according to the available data) and Abstracts Views on Vision4Press platform.
Data correspond to usage on the plateform after 2015. The current usage metrics is available 48-96 hours after online publication and is updated daily on week days.
Initial download of the metrics may take a while.