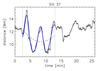
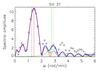
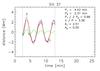
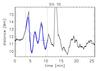
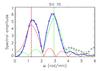
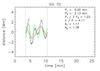
Fig. 3
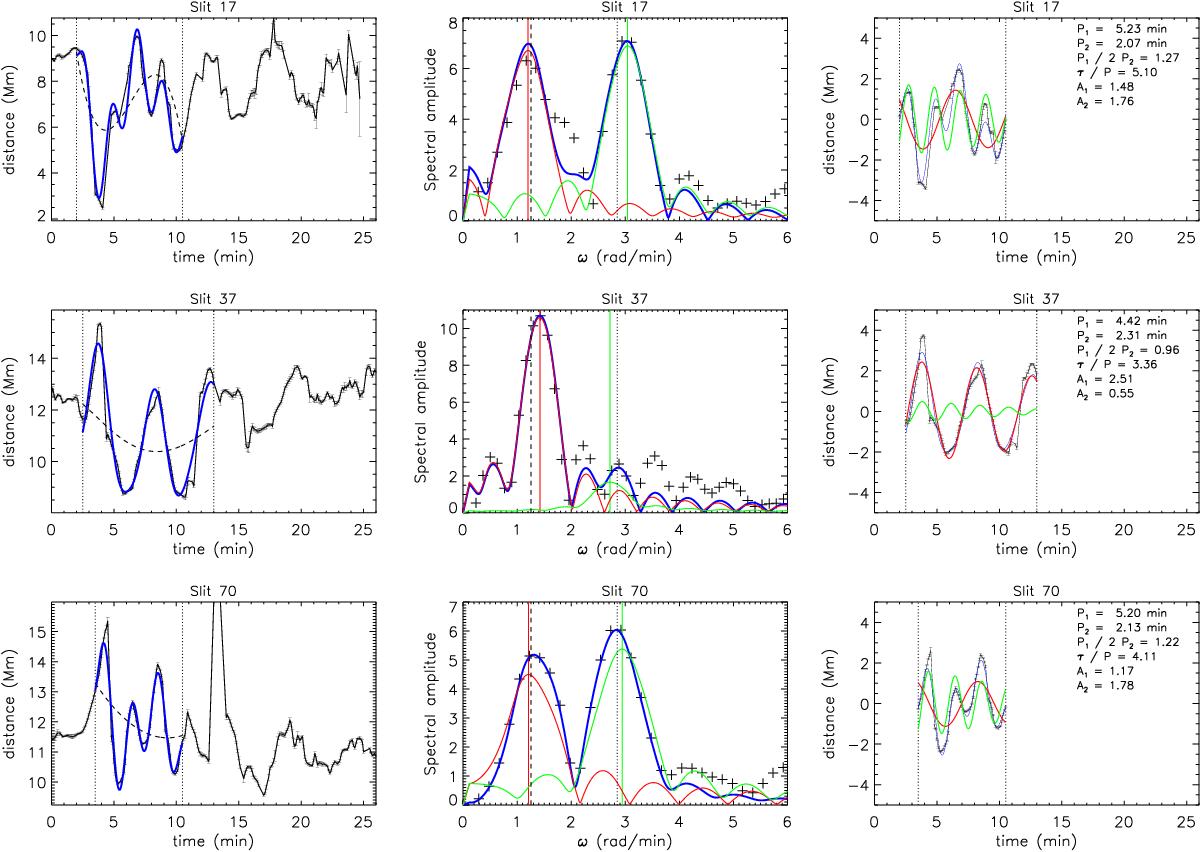
Analysis of kink oscillation signals for slits 17 (top), 37 (middle), and 70 (bottom). The left panels show the position of the loop axis varying in time. The blue curves correspond to the two-component fits given by Eq. (2). The dashed lines show the polynomial background trends and the vertical dotted lines denote the time interval over which the oscillation is analysed. The middle panels show the periodogram analysis of the detrended signals. The symbols correspond to the observational data and the blue curve to the two-component fit. The red and green curves give the spectral profile of the two components separately; the fitted frequencies are indicated by the vertical lines of the same colour. The vertical dashed and dotted lines show the frequencies of the two components averaged over 15 analysed slits. The right panels show the detrended signals with the fitted oscillation (blue curves) and the two individual comopnents (red and green curves).
Current usage metrics show cumulative count of Article Views (full-text article views including HTML views, PDF and ePub downloads, according to the available data) and Abstracts Views on Vision4Press platform.
Data correspond to usage on the plateform after 2015. The current usage metrics is available 48-96 hours after online publication and is updated daily on week days.
Initial download of the metrics may take a while.