Fig. 1
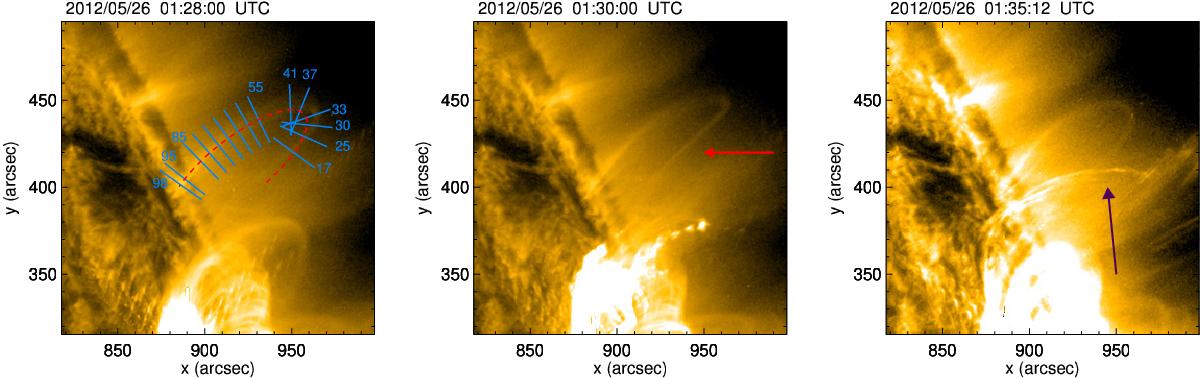
SDO/AIA 171 Å images of the loop before and during the oscillation. The dashed red line (left panel) shows the elliptical fit to the loop axis. Slits (solid blue lines) are taken perpendicular to this axis. The middle panel shows the loop after the lower leg (red arrow) has been displaced by the CME. The right panel shows the apparent plasma outflow (purple arrow) associated with the CME which obscures the view of the lower leg for most of the oscillation.
Current usage metrics show cumulative count of Article Views (full-text article views including HTML views, PDF and ePub downloads, according to the available data) and Abstracts Views on Vision4Press platform.
Data correspond to usage on the plateform after 2015. The current usage metrics is available 48-96 hours after online publication and is updated daily on week days.
Initial download of the metrics may take a while.