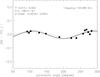
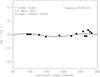
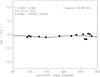
Fig. 4
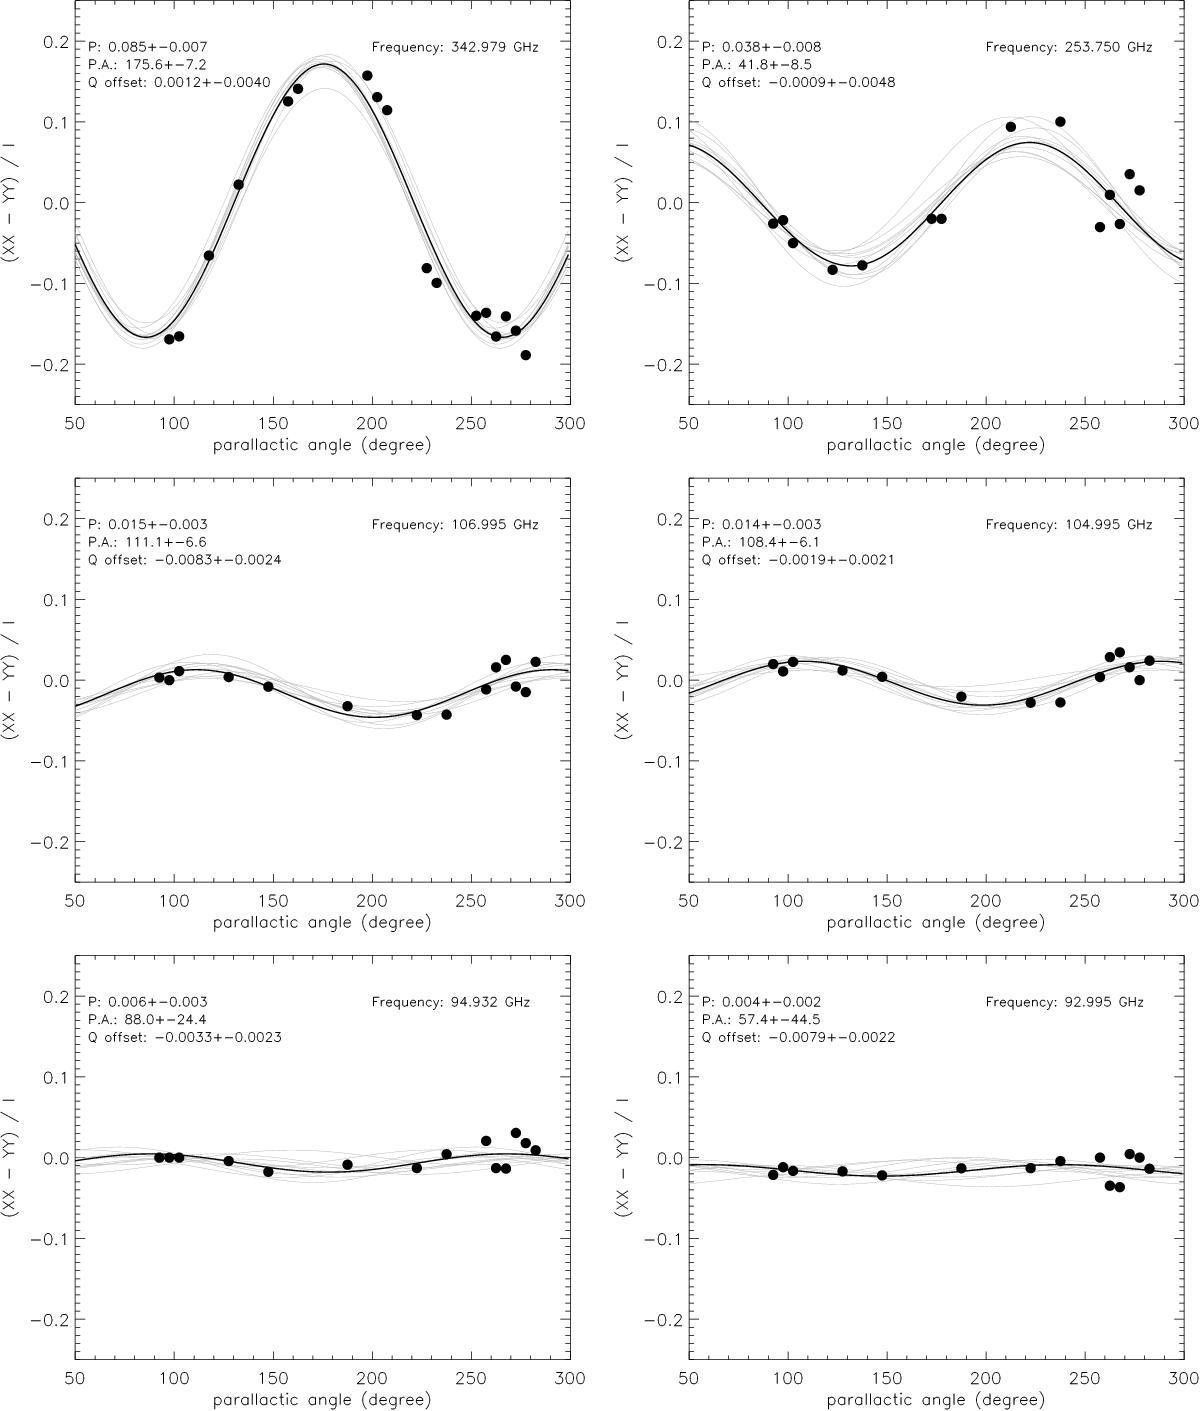
Fittings of the (XX − YY)/I intensity ratio, to determine polarization percentages and polarization position angles. Data presented in this figure are self-calibrated ALMA band 3 (bottom 4 panels, from each of the four spectral windows of band 3), 6 (top right), 7 (top left) observations of the Sgr A* on UTC 2012 May 18. XX and YY are intensities of the two orthogonal polarizations in the receiver frame. Only the uv-sampling range of >30 kλ was fitted for the band 3 (93–107 GHz) data. The best fits of polarization percentage (P), polarization position angle (in the receiver frame, i.e. Ψ − φ; PA), and a constant normalized Stokes Q offsets (Q offset), are provided in the upper left of each panel, which are represented by a black curve. For each observed frequency, errors of fitted quantities were determined by one standard deviation of fittings of 1000 random realizations of noisy data (details are in Sect. 3.2). Gray lines in each panel plot every 100 of the random realizations.
Current usage metrics show cumulative count of Article Views (full-text article views including HTML views, PDF and ePub downloads, according to the available data) and Abstracts Views on Vision4Press platform.
Data correspond to usage on the plateform after 2015. The current usage metrics is available 48-96 hours after online publication and is updated daily on week days.
Initial download of the metrics may take a while.