Fig. 6
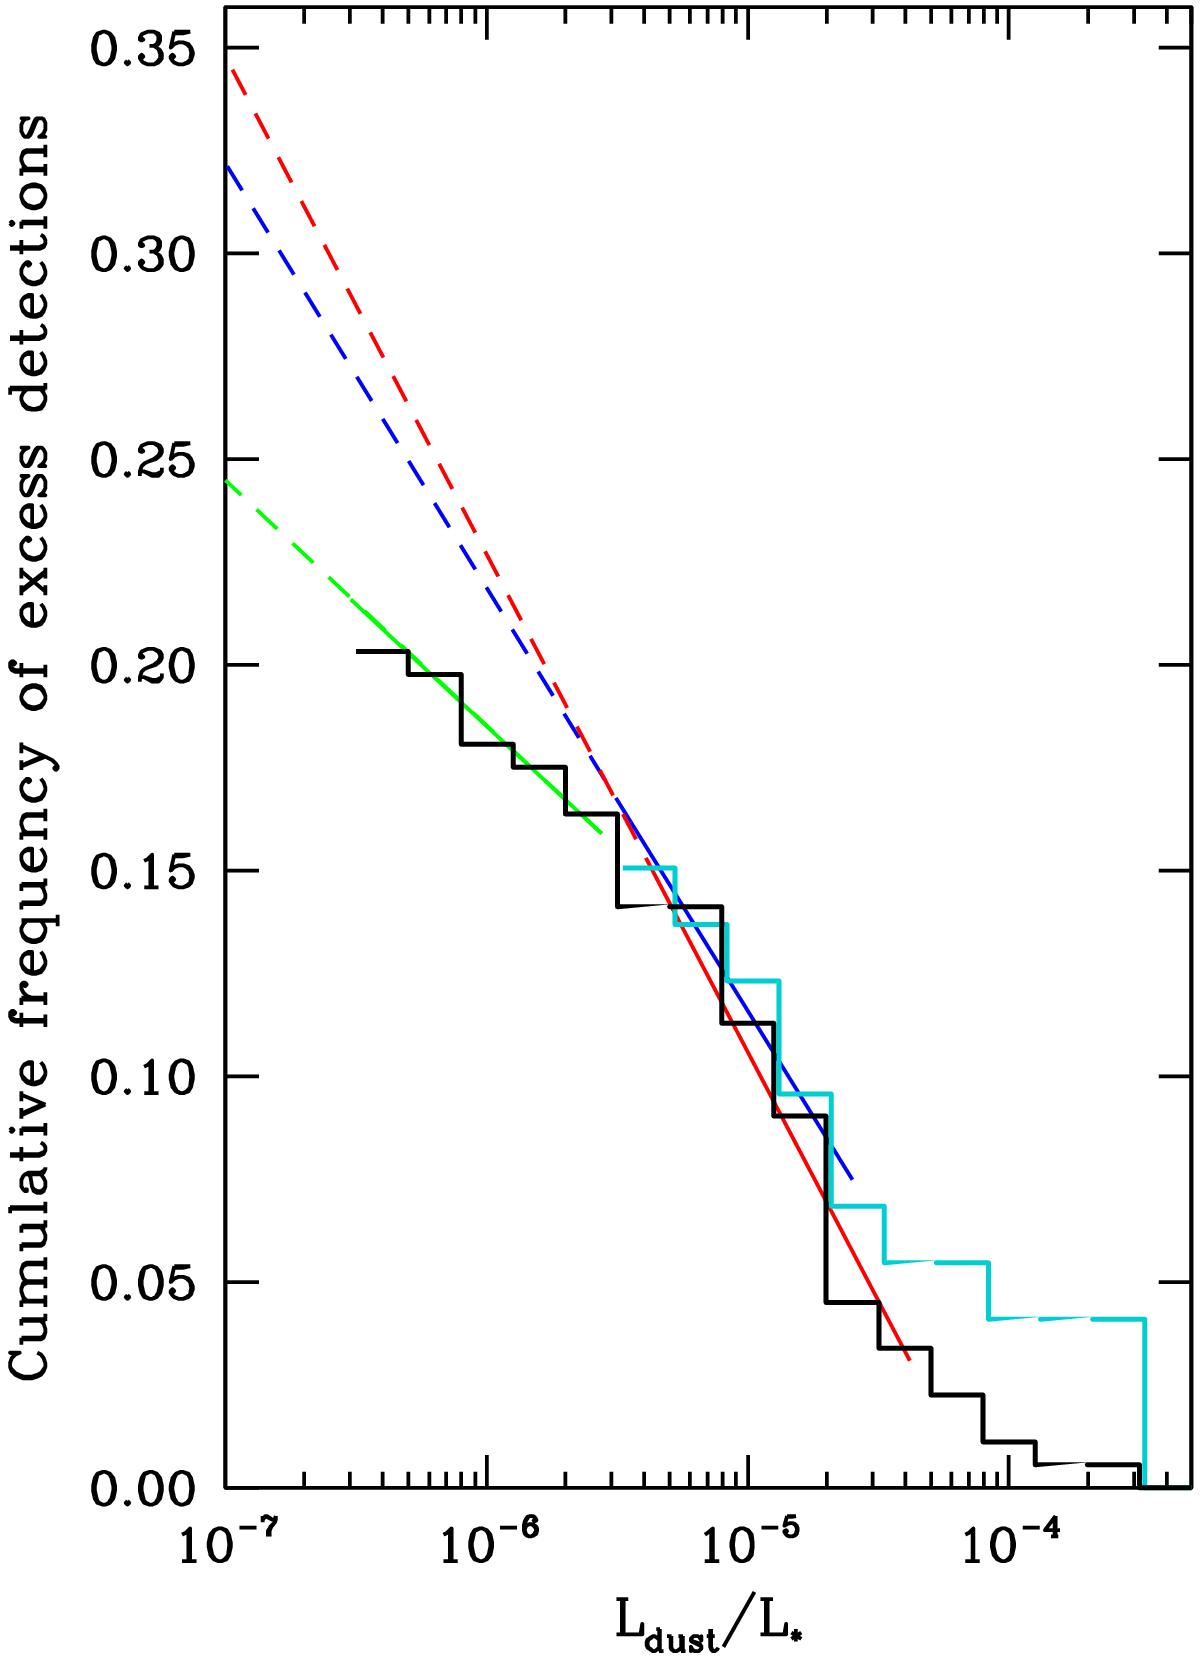
Cumulative distributions of the frequency of excesses obtained in this work (black) and those obtained from Spitzer/MIPS results Bryden et al. (2006; cyan), both plotted against fractional dust luminosity. The green straight line is a fit to the values of the frequencies at the less steep part of our cumulative distribution. The extrapolation down to 10-7, the current estimate of the Kuiper-belt fractional luminosity, gives a prediction for the incidence rate of excesses of ~0.25. The extrapolation from a straight line, plotted in red, fitted to the steeper part of the distribution, that mimics the MIPS results, gives a higher prediction ~0.35. The prediction from the Bryden et al. (2006) distribution, from the blue straight-line fit, is ~0.32. See text for details.
Current usage metrics show cumulative count of Article Views (full-text article views including HTML views, PDF and ePub downloads, according to the available data) and Abstracts Views on Vision4Press platform.
Data correspond to usage on the plateform after 2015. The current usage metrics is available 48-96 hours after online publication and is updated daily on week days.
Initial download of the metrics may take a while.