Fig. 5
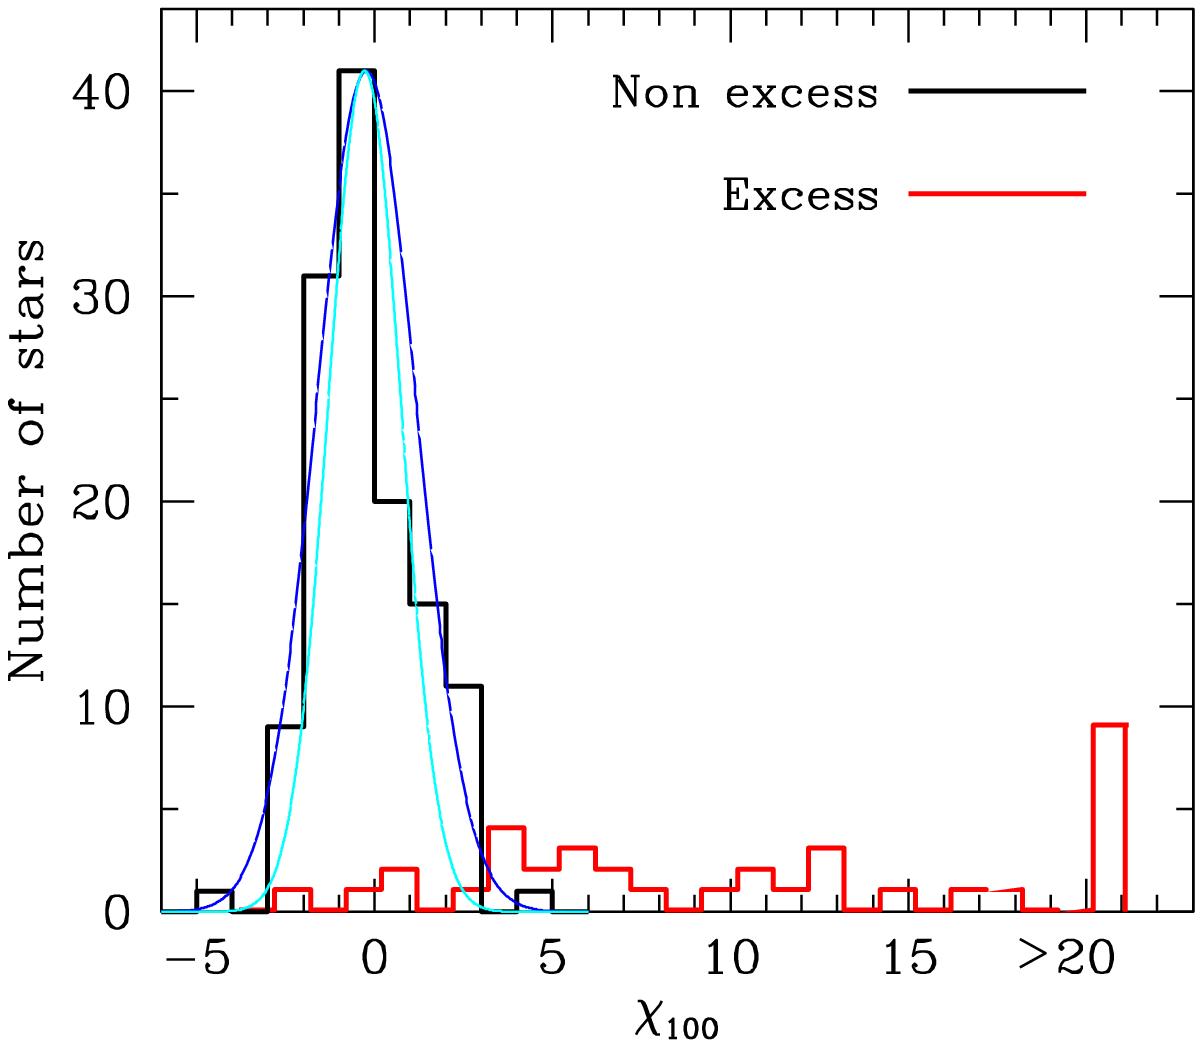
Plotted in black, the histogram of the 100 μm significance χ100 for the non-excess sources of the merged DUNES_DU and DUNES_DB samples with d ≤ 20 pc (dubious sources of both samples are not included). A Gaussian with σ = 1.40, the standard deviation of the χ100 values for these sources, is plotted in blue. In cyan, we show a Gaussian with σ = 1.02, corresponding to the subsample of non-excess sources with −2.0 <χ100< 2.0. In red, the distribution of χ100 for the excess sources is also displayed. This figure is an extension of Fig. 6 in E13. See text for details.
Current usage metrics show cumulative count of Article Views (full-text article views including HTML views, PDF and ePub downloads, according to the available data) and Abstracts Views on Vision4Press platform.
Data correspond to usage on the plateform after 2015. The current usage metrics is available 48-96 hours after online publication and is updated daily on week days.
Initial download of the metrics may take a while.