Fig. 10
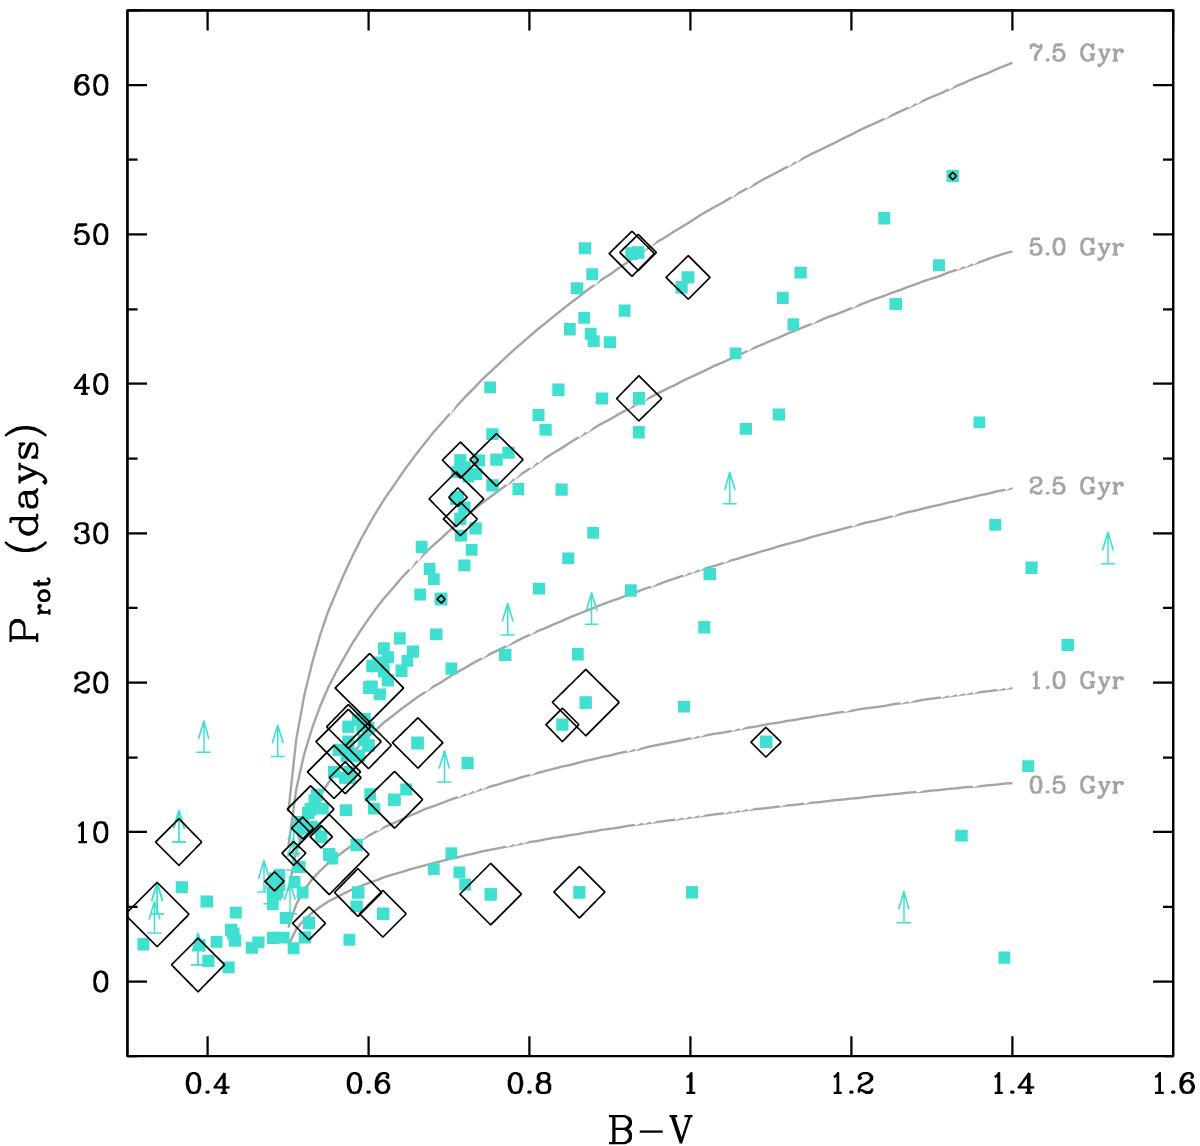
Diagram of Prot – (B − V) showing the stars of the full DUNES sample with d ≤ 20 pc (cyan squares). As in Fig. 9 the stars identified as having far-infrared excesses are plotted as diamonds with a size proportional to the value of the fractional dust luminosity. Superimposed are five gyrochrones computed following Mamajek & Hillenbrand (2008; see Appendix A in this work).
Current usage metrics show cumulative count of Article Views (full-text article views including HTML views, PDF and ePub downloads, according to the available data) and Abstracts Views on Vision4Press platform.
Data correspond to usage on the plateform after 2015. The current usage metrics is available 48-96 hours after online publication and is updated daily on week days.
Initial download of the metrics may take a while.