Fig. 7
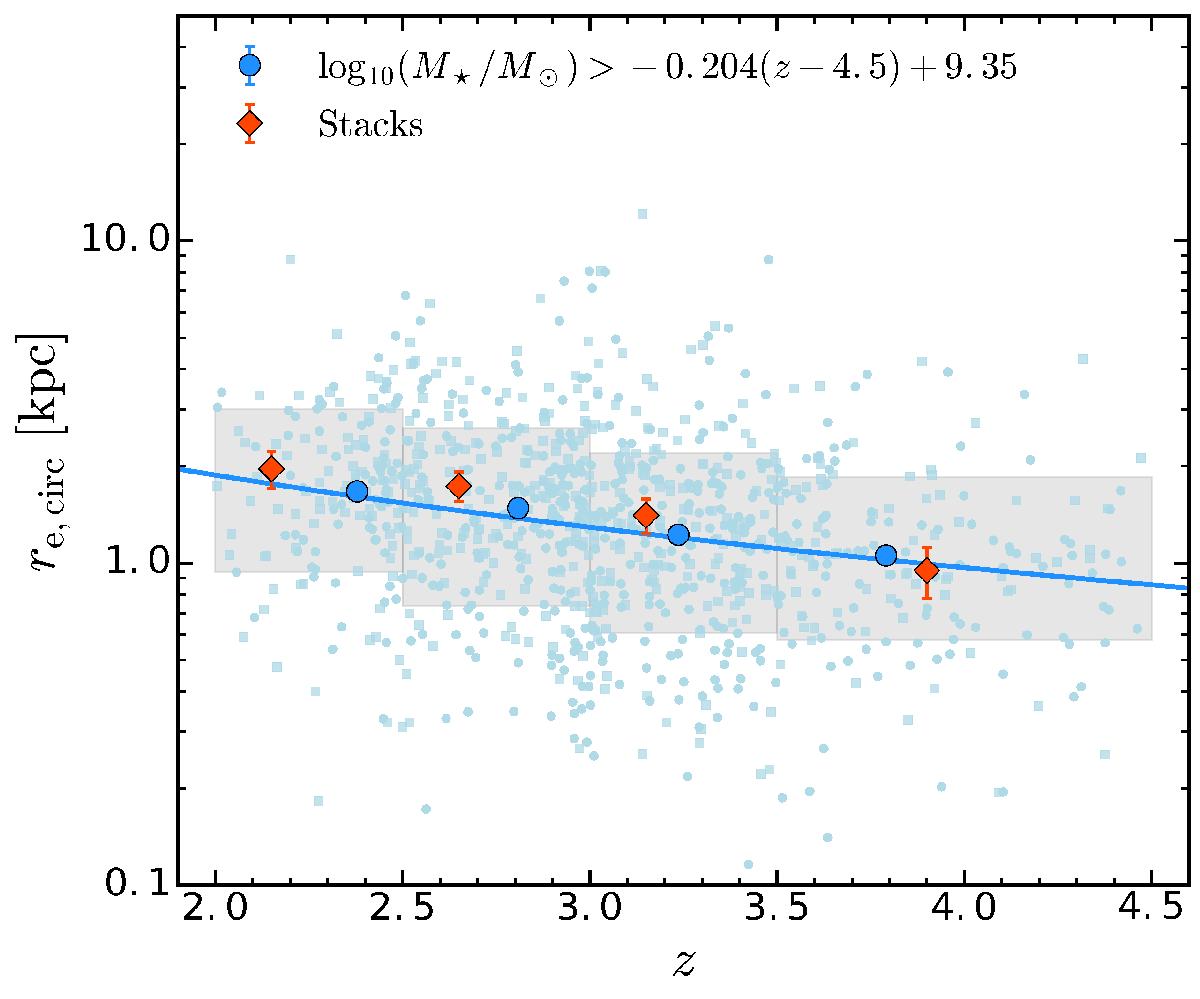
Size evolution with redshift. Each galaxy with a good size measurement is plotted with a small blue point (squares for redshift confidence 2 and 9, circles for 3 and 4). The median values (in redshift and size for each bin) and respective error (![]() ) per redshift bin are shown by the large blue points with the error bars. The shaded region delimits the 16th and 84th percentiles including 68% of the sample in each redshift bin. The red diamonds are the effective radii of stacked images computed with the method described in Sect. 5 and are plotted at the center of the redshift bin.
) per redshift bin are shown by the large blue points with the error bars. The shaded region delimits the 16th and 84th percentiles including 68% of the sample in each redshift bin. The red diamonds are the effective radii of stacked images computed with the method described in Sect. 5 and are plotted at the center of the redshift bin.
Current usage metrics show cumulative count of Article Views (full-text article views including HTML views, PDF and ePub downloads, according to the available data) and Abstracts Views on Vision4Press platform.
Data correspond to usage on the plateform after 2015. The current usage metrics is available 48-96 hours after online publication and is updated daily on week days.
Initial download of the metrics may take a while.