Fig. 5
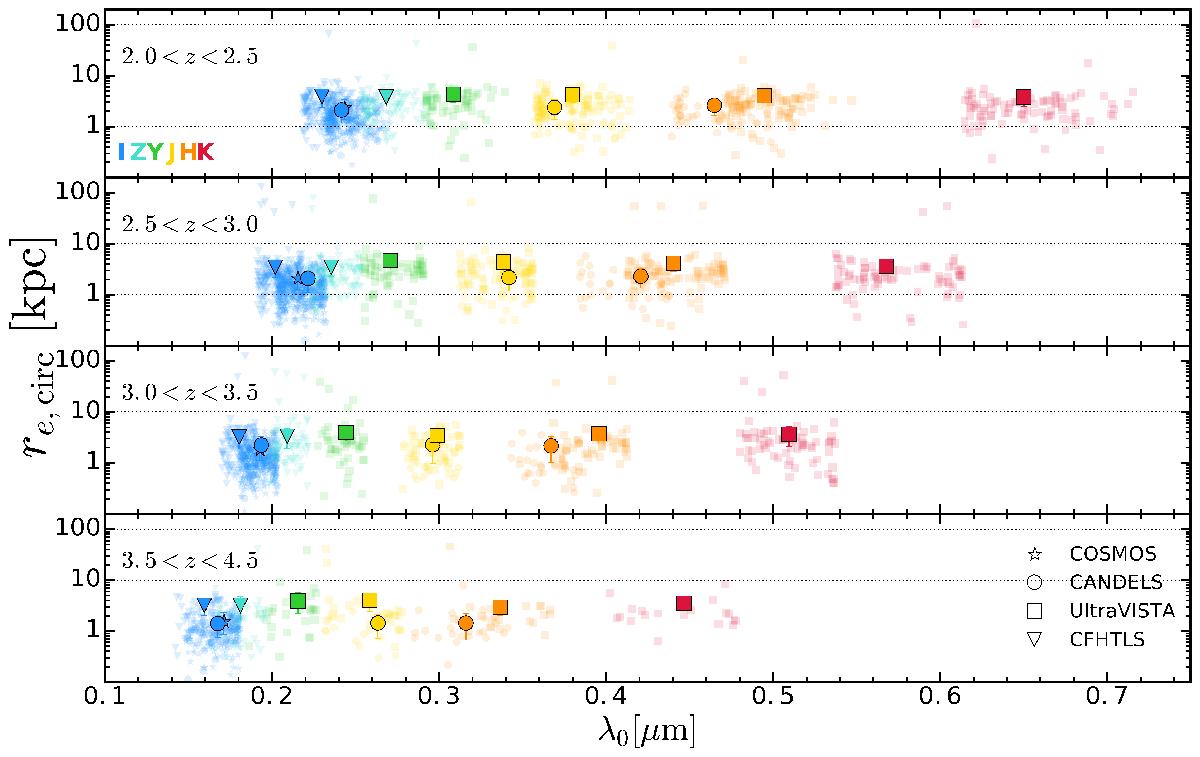
Measured sizes as a function of wavelength for galaxies with log 10(M⋆) > 9.5 at 2 <z< 4.5 in the COSMOS field. Different symbols correspond to different surveys (symbol coding in the bottom panel) and different colors to different observed bands (color coding in the top panel). Each point represents the size of a given galaxy at the rest-frame wavelength of the pivot of the filter.
Current usage metrics show cumulative count of Article Views (full-text article views including HTML views, PDF and ePub downloads, according to the available data) and Abstracts Views on Vision4Press platform.
Data correspond to usage on the plateform after 2015. The current usage metrics is available 48-96 hours after online publication and is updated daily on week days.
Initial download of the metrics may take a while.