Fig. A.2
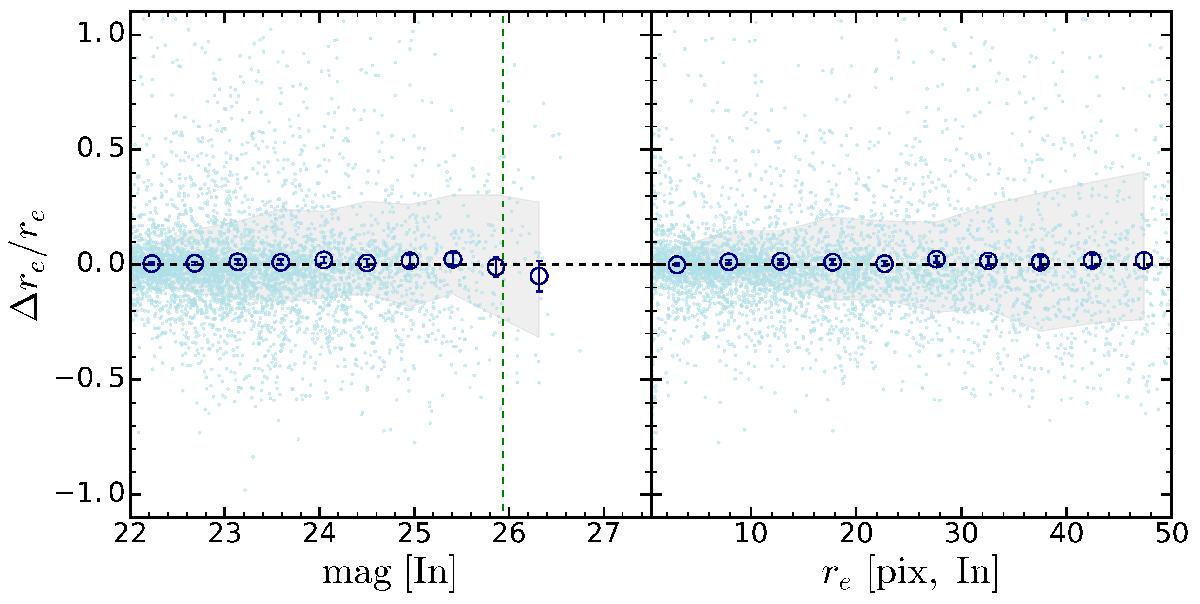
Variance of the value of re for a set of 15 000 galaxies as a function of input magnitude (left) and effective radii (right). Only galaxies where GALFIT convergence was attained are included in this figure. The large dark blue points represent the median sizes per bin, the error bar in the y-axis is ![]() . The shaded region delimits the 16th and 84th percentiles and includes 68% of the sample of each bin.
. The shaded region delimits the 16th and 84th percentiles and includes 68% of the sample of each bin.
Current usage metrics show cumulative count of Article Views (full-text article views including HTML views, PDF and ePub downloads, according to the available data) and Abstracts Views on Vision4Press platform.
Data correspond to usage on the plateform after 2015. The current usage metrics is available 48-96 hours after online publication and is updated daily on week days.
Initial download of the metrics may take a while.