Fig. A.1
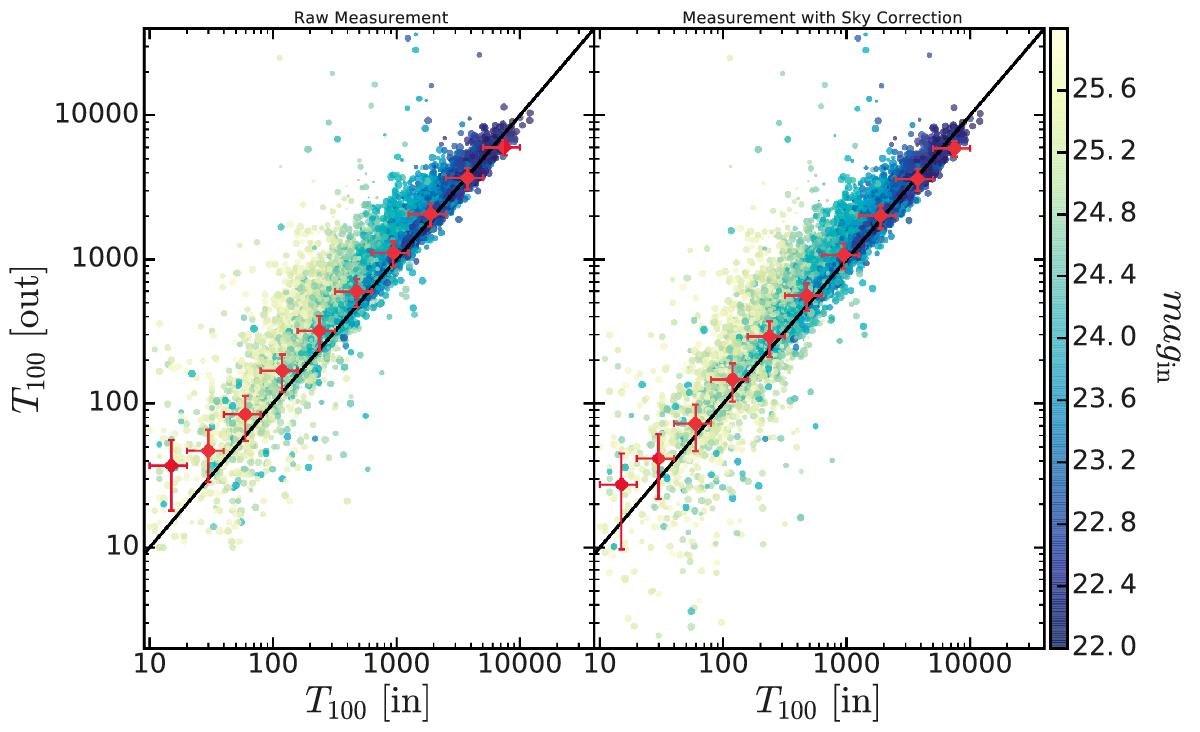
Results of computing of T100 for a set of 15 000 galaxies. The points are color coded by their input magnitude, and the size of each point is determined by the input re of the GALFIT model. The solid red line denotes the one-to-one relation. The left panel refers to the size measurement without any correction, and the right panel presents the same results, but after applying the same sky correction as described in Sect. 4.6. The large red points represent the median sizes per bin, the error bar in the x-axis represents the bin width, and the y-axis represents the median absolute dispersion of the bin.
Current usage metrics show cumulative count of Article Views (full-text article views including HTML views, PDF and ePub downloads, according to the available data) and Abstracts Views on Vision4Press platform.
Data correspond to usage on the plateform after 2015. The current usage metrics is available 48-96 hours after online publication and is updated daily on week days.
Initial download of the metrics may take a while.