Fig. 22
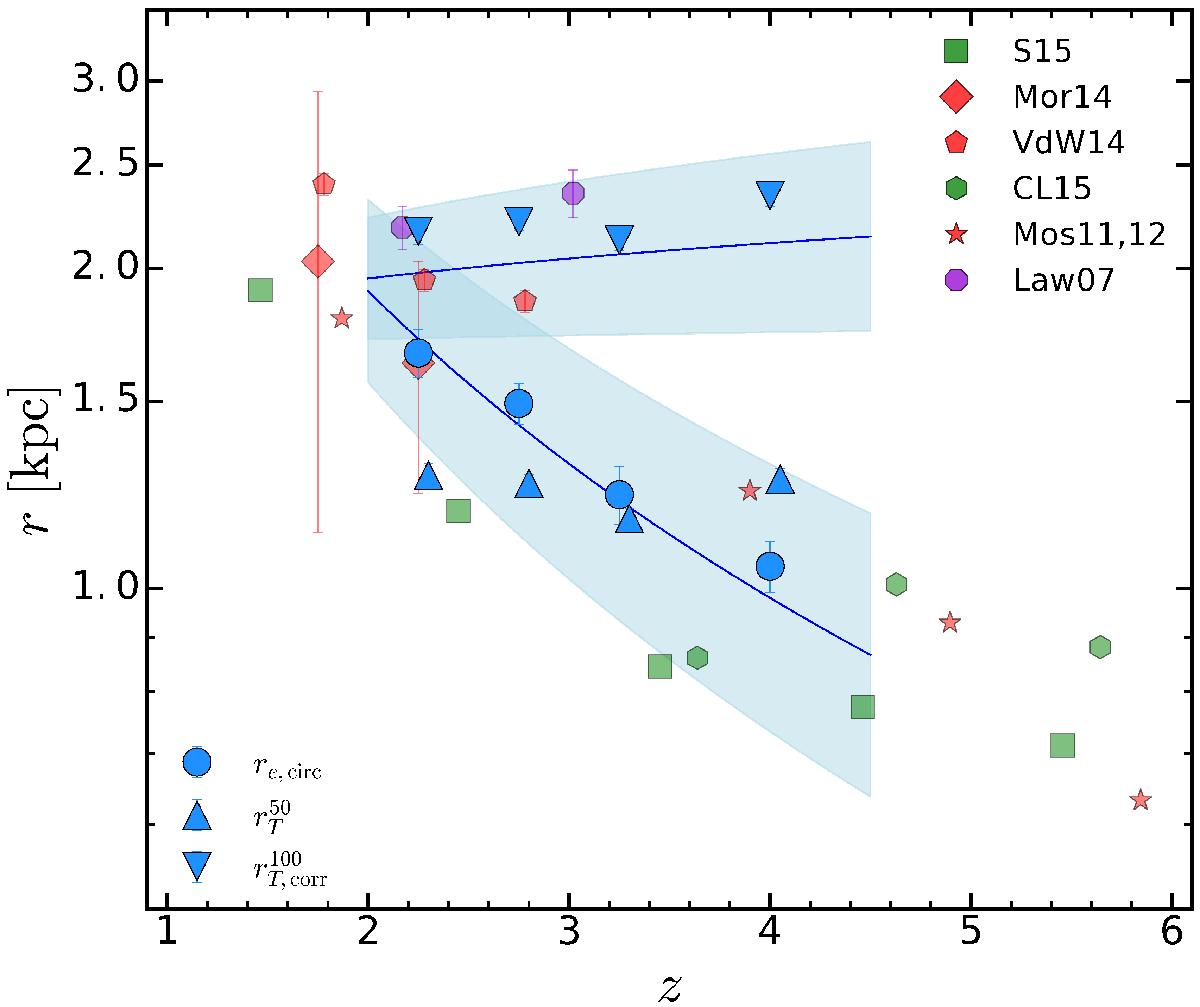
Compilation of size measurements at different redshifts for a number of different studies. First, in blue we show the measurements of this paper. Circles are taken from the GALFIT effective radius, and the triangles and inverted triangles are from ![]() and
and ![]() respectively. The blue solid lines and respective shaded regions show the derived evolution for re,circ and
respectively. The blue solid lines and respective shaded regions show the derived evolution for re,circ and ![]() . Each other color represents a different sample selection (green for luminosity-selected samples, red for stellar-mass-selected samples, and purple for a different selection) and each symbol represents a different study. They are squares (Shibuya et al. 2015), 0.3L∗<L< 1L∗; diamonds (Morishita et al. 2014), 10.0 < log 10(M⋆/M⊙) < 10.5; pentagons (van der Wel et al. 2014) , 10.0 < log 10(M⋆/M⊙) < 10.5; hexagons (Curtis-Lake et al. 2016), 0.3L∗<L< 1L∗; stars (Mosleh et al. 2011, 2012), 9.5 < log 10(M⋆/M⊙) < 10.4; octagons (Law et al. 2007), spectroscopic sample, no mass or luminosity selection.
. Each other color represents a different sample selection (green for luminosity-selected samples, red for stellar-mass-selected samples, and purple for a different selection) and each symbol represents a different study. They are squares (Shibuya et al. 2015), 0.3L∗<L< 1L∗; diamonds (Morishita et al. 2014), 10.0 < log 10(M⋆/M⊙) < 10.5; pentagons (van der Wel et al. 2014) , 10.0 < log 10(M⋆/M⊙) < 10.5; hexagons (Curtis-Lake et al. 2016), 0.3L∗<L< 1L∗; stars (Mosleh et al. 2011, 2012), 9.5 < log 10(M⋆/M⊙) < 10.4; octagons (Law et al. 2007), spectroscopic sample, no mass or luminosity selection.
Current usage metrics show cumulative count of Article Views (full-text article views including HTML views, PDF and ePub downloads, according to the available data) and Abstracts Views on Vision4Press platform.
Data correspond to usage on the plateform after 2015. The current usage metrics is available 48-96 hours after online publication and is updated daily on week days.
Initial download of the metrics may take a while.