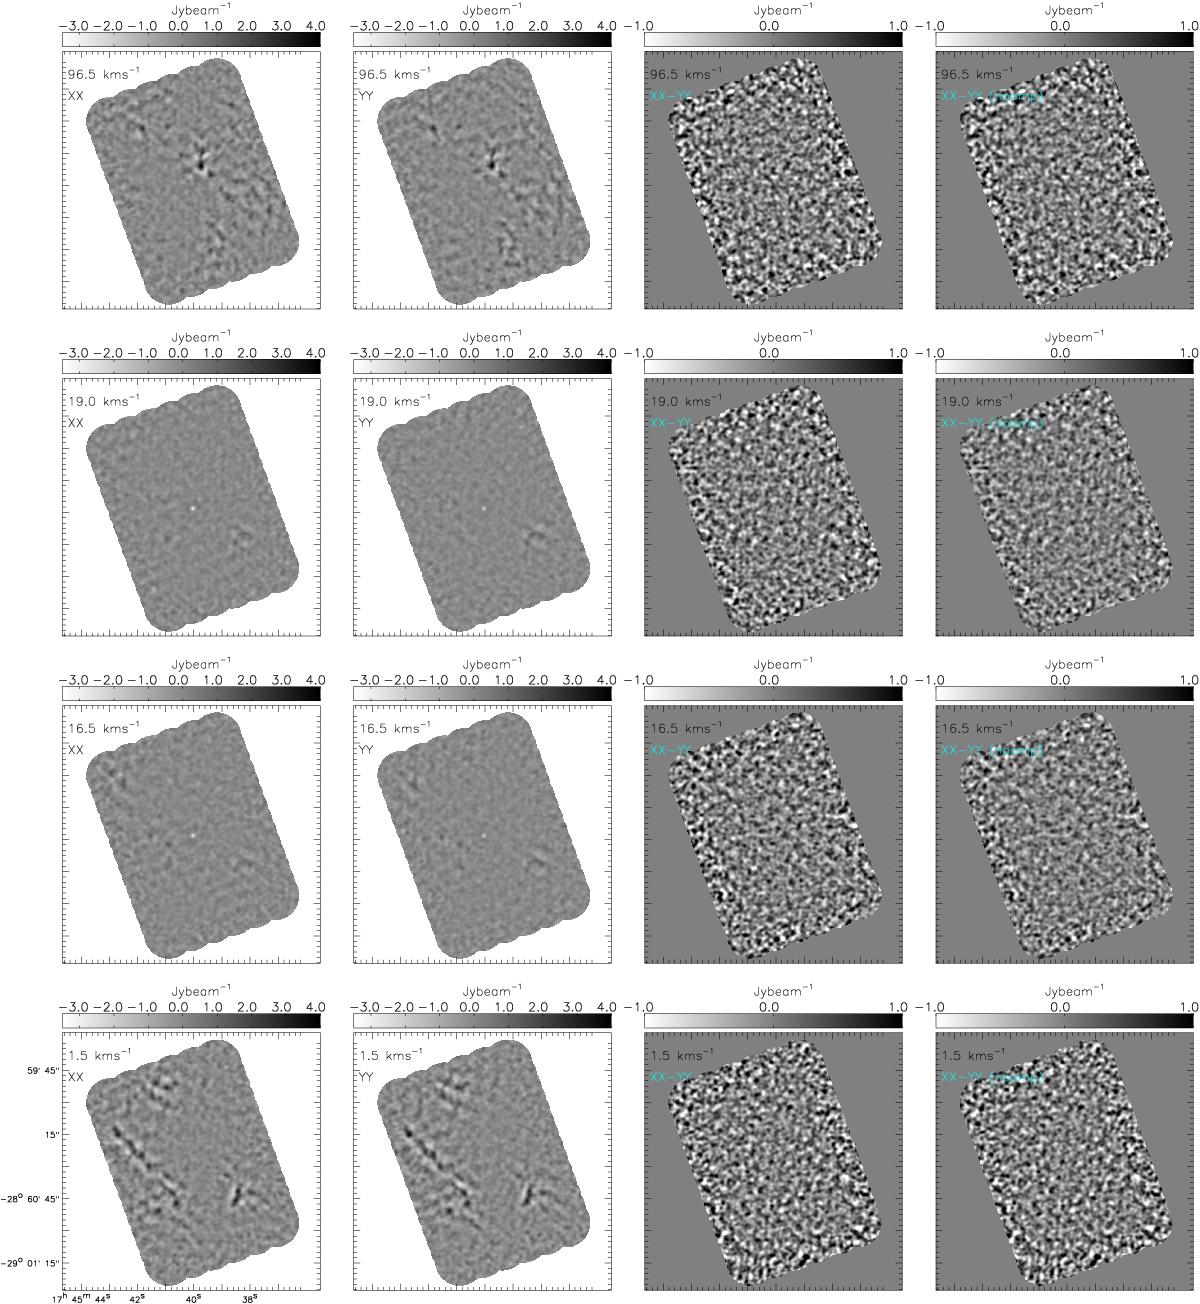
Fig. 7
Left to right columns: XX, YY, XX − YY, and XX – aCI(ν)YYsynthesized intensity maps of selected velocity channels. These images were generated using the 12 m array data only (Sect. 2), and were further tapered by a Gaussian weighting function of ![]() . The Ci line emission close to vlsr ~ 20 km s-1 is subject to foreground absorption, such that the images are dominated by the point-like absorption signature against Sgr A*. Extended Ci emission features surrounding Sgr A* are present away from vlsr ~ 20 km s-1.
. The Ci line emission close to vlsr ~ 20 km s-1 is subject to foreground absorption, such that the images are dominated by the point-like absorption signature against Sgr A*. Extended Ci emission features surrounding Sgr A* are present away from vlsr ~ 20 km s-1.
Current usage metrics show cumulative count of Article Views (full-text article views including HTML views, PDF and ePub downloads, according to the available data) and Abstracts Views on Vision4Press platform.
Data correspond to usage on the plateform after 2015. The current usage metrics is available 48-96 hours after online publication and is updated daily on week days.
Initial download of the metrics may take a while.