Fig. 6
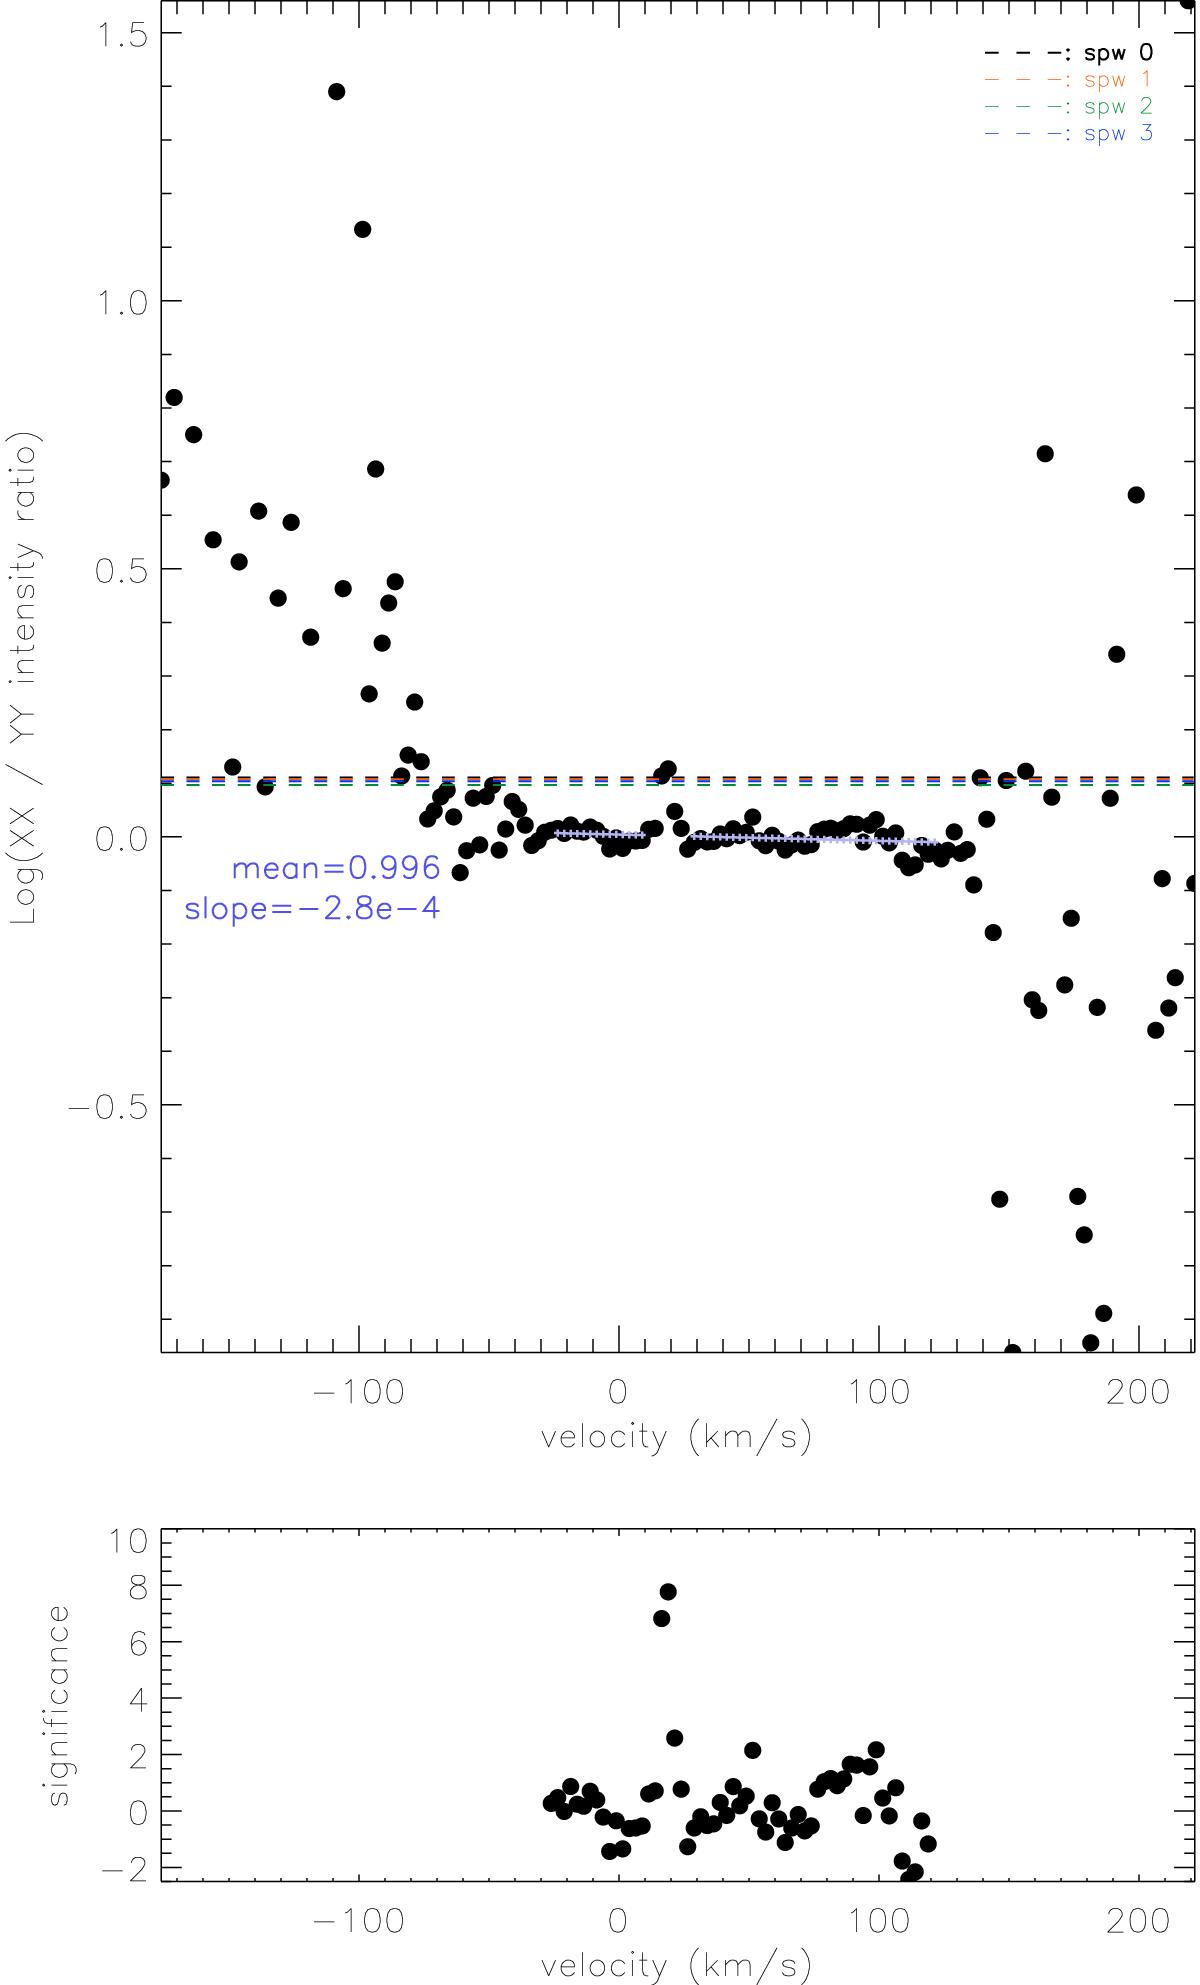
Top panel: derived intensity ratio between the XX and the YY correlations (![]() ) from the Ci line velocity channel synthesized image, as a function of vlsr. We overplotted the XX and YY intensity ratios derived from the continuum data of the inner 7 12 m array mosaic fields (dashed lines, color coding the four spectral windows). The large scattering in the redshifted and blueshifted ends are because we did not detect Ci emission or absorption in those channels, and therefore fittings of
) from the Ci line velocity channel synthesized image, as a function of vlsr. We overplotted the XX and YY intensity ratios derived from the continuum data of the inner 7 12 m array mosaic fields (dashed lines, color coding the four spectral windows). The large scattering in the redshifted and blueshifted ends are because we did not detect Ci emission or absorption in those channels, and therefore fittings of ![]() did not converge. We performed linear regression for the high S/N spectral channels, and derived the ±1 standard deviation (
did not converge. We performed linear regression for the high S/N spectral channels, and derived the ±1 standard deviation (![]() ) of the differences from the regression line. The result of the linear regression is shown by light blue symbols. We plot (
) of the differences from the regression line. The result of the linear regression is shown by light blue symbols. We plot (![]() )/(
)/(![]() ) in the bottom panel.
) in the bottom panel.
Current usage metrics show cumulative count of Article Views (full-text article views including HTML views, PDF and ePub downloads, according to the available data) and Abstracts Views on Vision4Press platform.
Data correspond to usage on the plateform after 2015. The current usage metrics is available 48-96 hours after online publication and is updated daily on week days.
Initial download of the metrics may take a while.