Fig. 4
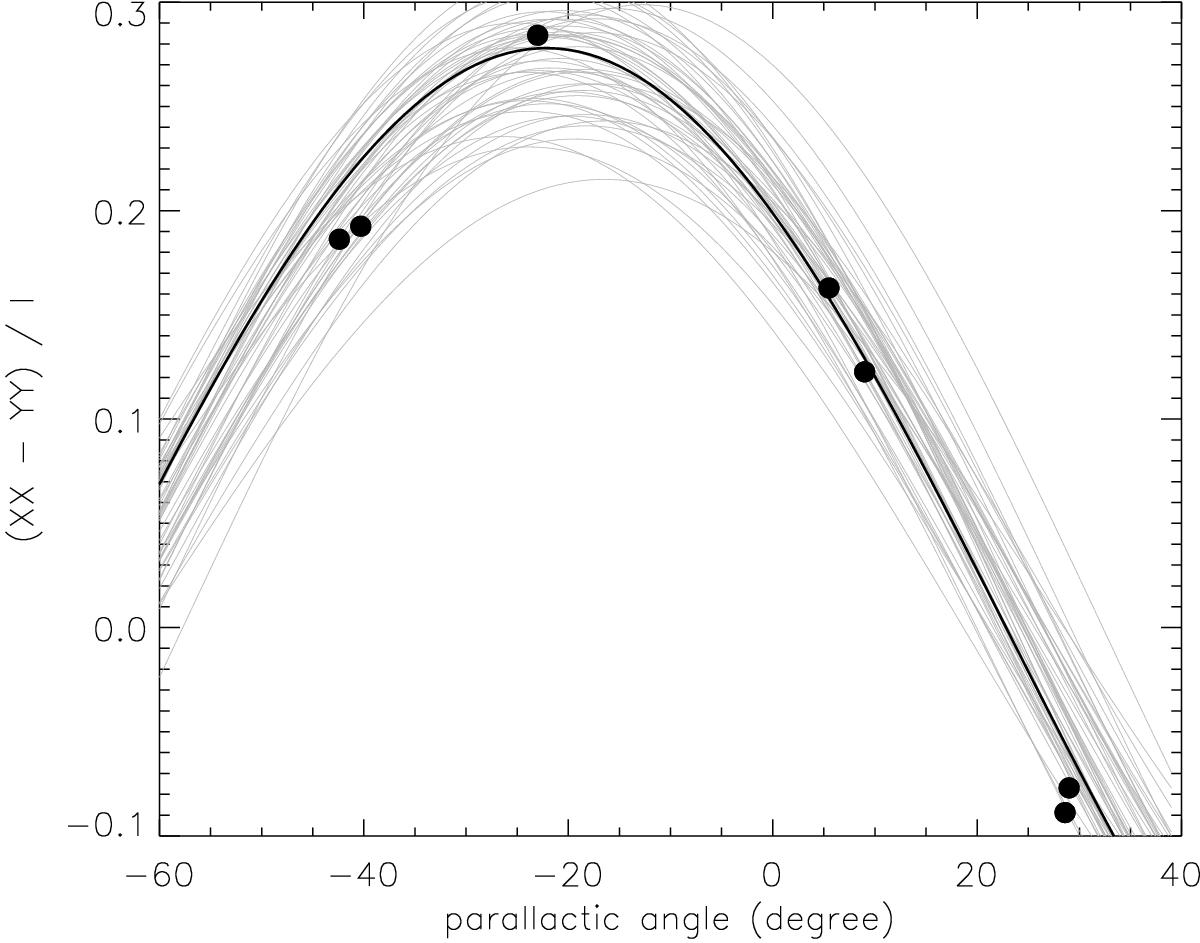
Normalized intensity difference of the XX and YY correlations of Sgr A*, observed by the ALMA 12 m array (symbols), and a black curve representing our best fit to these data. The constant polarization percentage and polarization position angle obtained from our best fit model are 14% ± 1.2% and 158°± 3°, respectively. The gray curves show 50 independent random realizations of models with constant polarization percentage and polarization position angle, which characterize the error bars we give. We caution that these quantities are not fully constrained without the measurements of the XY and YX correlations.
Current usage metrics show cumulative count of Article Views (full-text article views including HTML views, PDF and ePub downloads, according to the available data) and Abstracts Views on Vision4Press platform.
Data correspond to usage on the plateform after 2015. The current usage metrics is available 48-96 hours after online publication and is updated daily on week days.
Initial download of the metrics may take a while.