Fig. 3
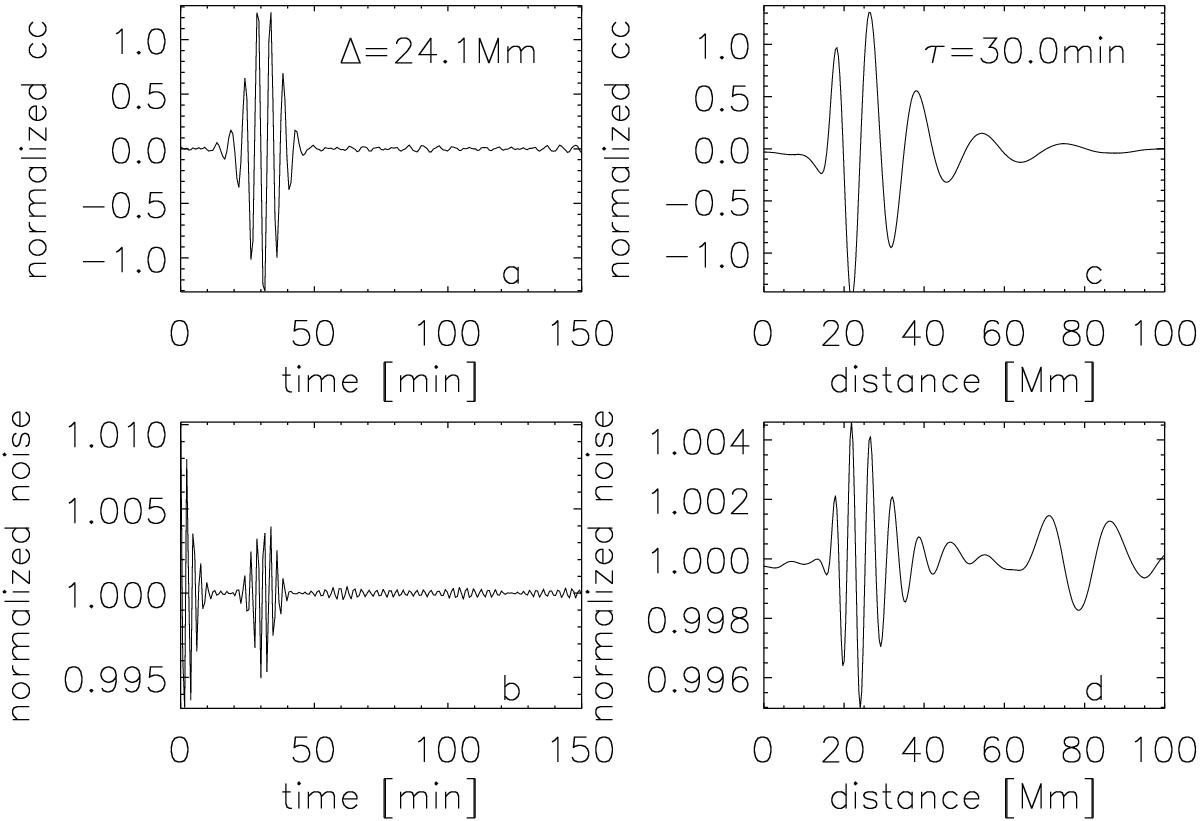
Expectation value of the cross-covariance function (Panels a), c)) and its noise, σ(Δ,τ), (Panels b), d)) for the full p-mode power spectrum of HMI Doppler observations (Fig. 2). Panels a) and b) are cuts at Δ = 24.1 Mm, and Panels c) and d) are cuts at τ = 30.0 min. The cross-covariance (cc) function and the noise are both normalized by ![]() .
.
Current usage metrics show cumulative count of Article Views (full-text article views including HTML views, PDF and ePub downloads, according to the available data) and Abstracts Views on Vision4Press platform.
Data correspond to usage on the plateform after 2015. The current usage metrics is available 48-96 hours after online publication and is updated daily on week days.
Initial download of the metrics may take a while.