Free Access
Fig. 2
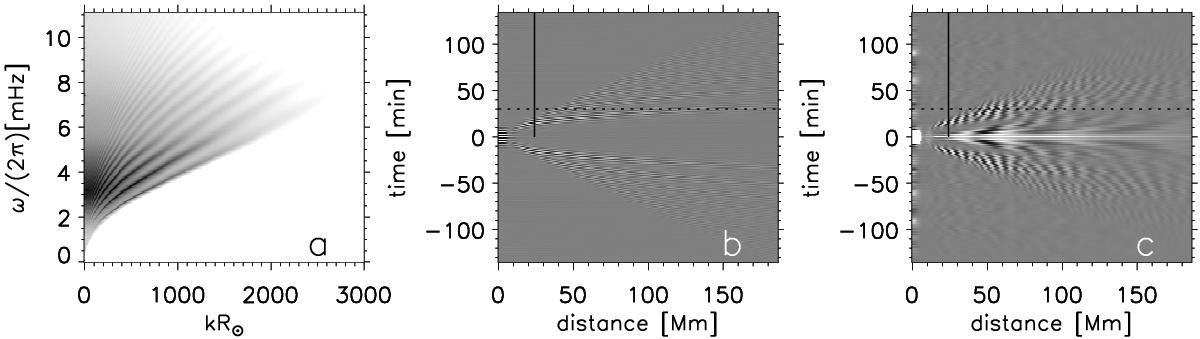
Example of the case of p-mode power spectrum of HMI Doppler observations: power spectra (Panel a)) in logarithmic gray scale, cross-covariance function ![]() (Panel b)), and
(Panel b)), and ![]() (Panel c)). The (corresponding) cuts at the solid vertical and dashed horizontal lines on the Panels b) and c) are shown in Fig. 3.
(Panel c)). The (corresponding) cuts at the solid vertical and dashed horizontal lines on the Panels b) and c) are shown in Fig. 3.
Current usage metrics show cumulative count of Article Views (full-text article views including HTML views, PDF and ePub downloads, according to the available data) and Abstracts Views on Vision4Press platform.
Data correspond to usage on the plateform after 2015. The current usage metrics is available 48-96 hours after online publication and is updated daily on week days.
Initial download of the metrics may take a while.