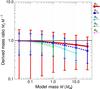
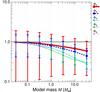
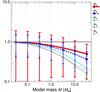
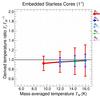
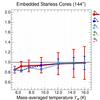
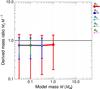
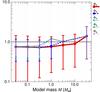
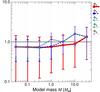
Fig. 8
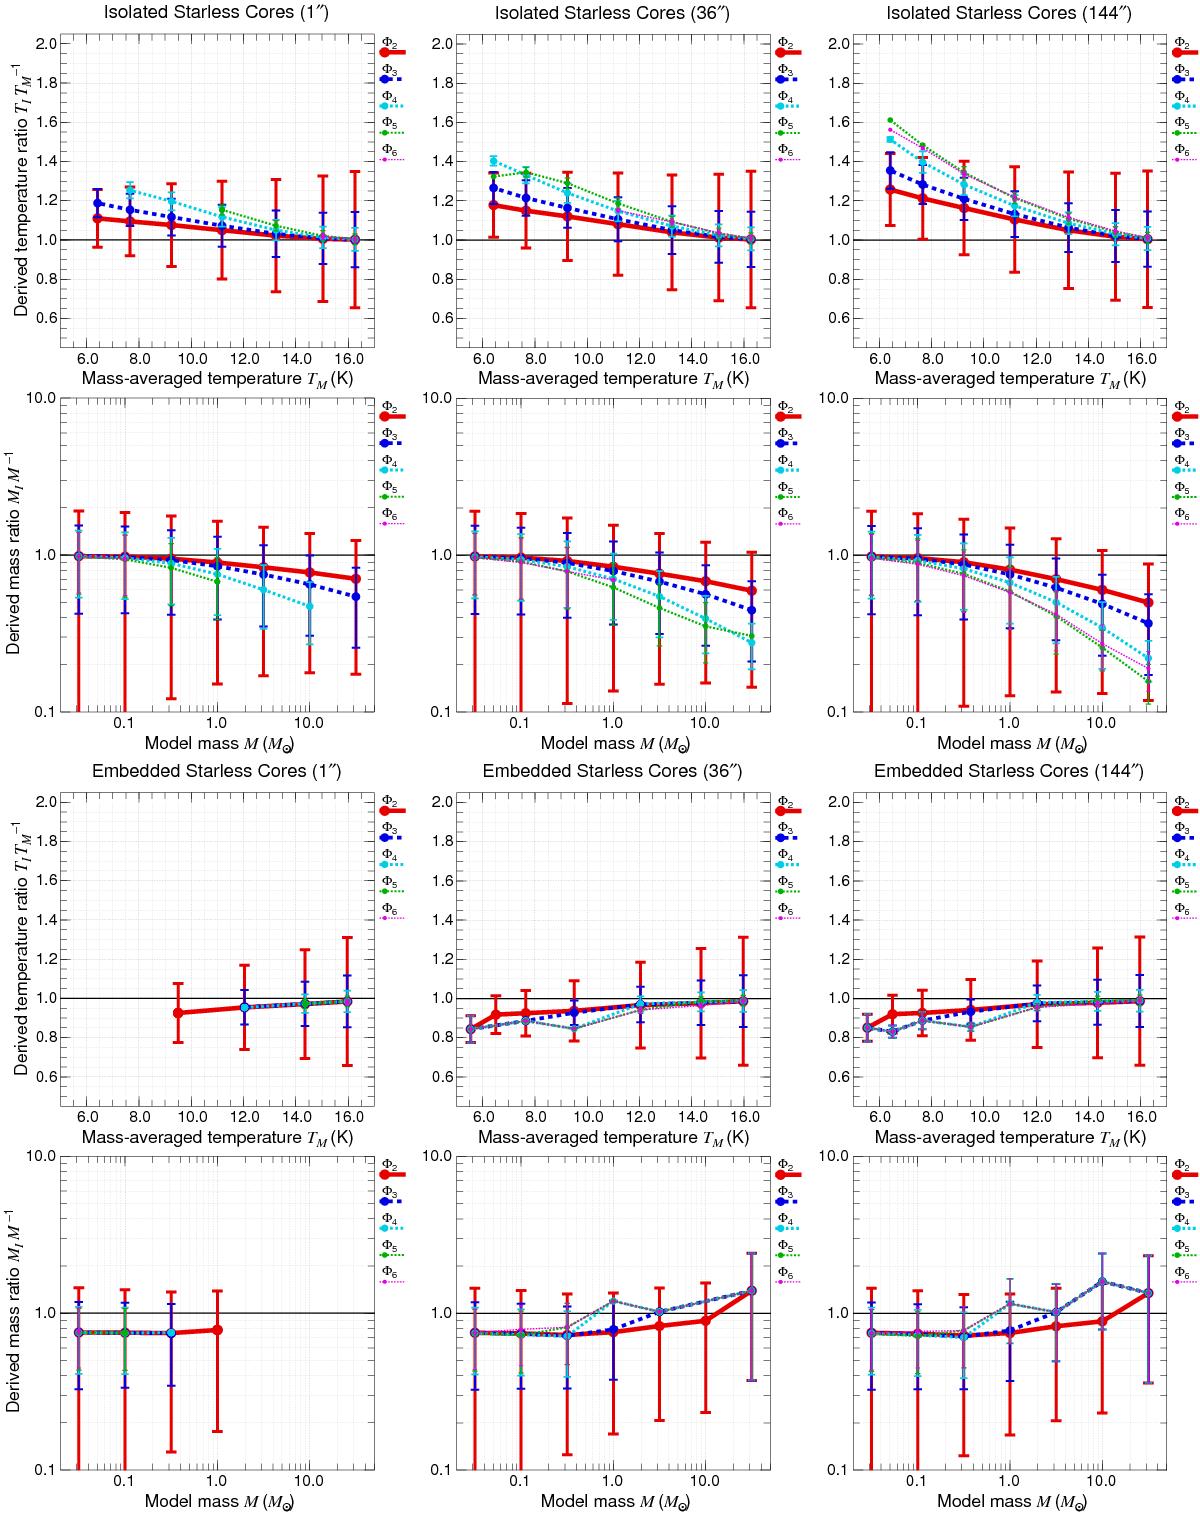
Temperatures Tℐ and masses Mℐ derived from fitting images ℐν of both isolated and embedded starless cores vs. the true model values of TM and M for correct β = 2. The three columns of panels present results for three angular resolutions (resolved, partially resolved, and unresolved cases) and for various subsets Φn of pixel intensities. Error bars represent the 1 × σ uncertainties of the derived Tℐ and Mℐ (computed over all pixels as the NH2-averaged errors of TNij and integrated errors of NH2, correspondingly), combined with the assumed ± 20% uncertainties of η, κ0, and D (Sect. 3.4). Less reliable results (n−γ + 1 <χ2< 10 in some pixels) are shown without error bars. See Fig. 6 for more details.

Current usage metrics show cumulative count of Article Views (full-text article views including HTML views, PDF and ePub downloads, according to the available data) and Abstracts Views on Vision4Press platform.
Data correspond to usage on the plateform after 2015. The current usage metrics is available 48-96 hours after online publication and is updated daily on week days.
Initial download of the metrics may take a while.