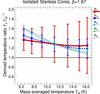
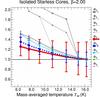
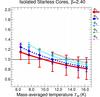
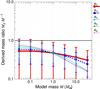
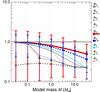
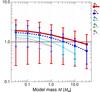
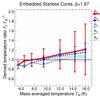
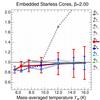
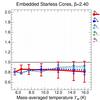
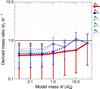
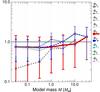
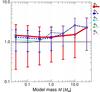
Fig. 6

Temperatures TF and masses MF derived from fitting Fν of both isolated and embedded starless cores vs. the true model values of TM and M for three β values (1.67, 2, 2.4). For various subsets Φn of fluxes, results from successful thinbody and modbody fits (Sect. 3.4) are displayed by the colored and gray lines, respectively. Error bars represent the 1 × σ uncertainties of the derived parameters returned by the fitting routine combined with the assumed ± 20% uncertainties of η, κ0, and D (Sect. 3.4). The black solid lines show the locations where TF and MF are equal to the true values. To preserve clarity of the plots, much less accurate modbody results are displayed only for correct β = 2 and without error bars.
Current usage metrics show cumulative count of Article Views (full-text article views including HTML views, PDF and ePub downloads, according to the available data) and Abstracts Views on Vision4Press platform.
Data correspond to usage on the plateform after 2015. The current usage metrics is available 48-96 hours after online publication and is updated daily on week days.
Initial download of the metrics may take a while.