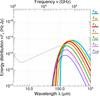
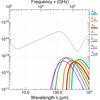
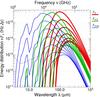
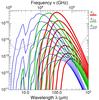
Fig. 4
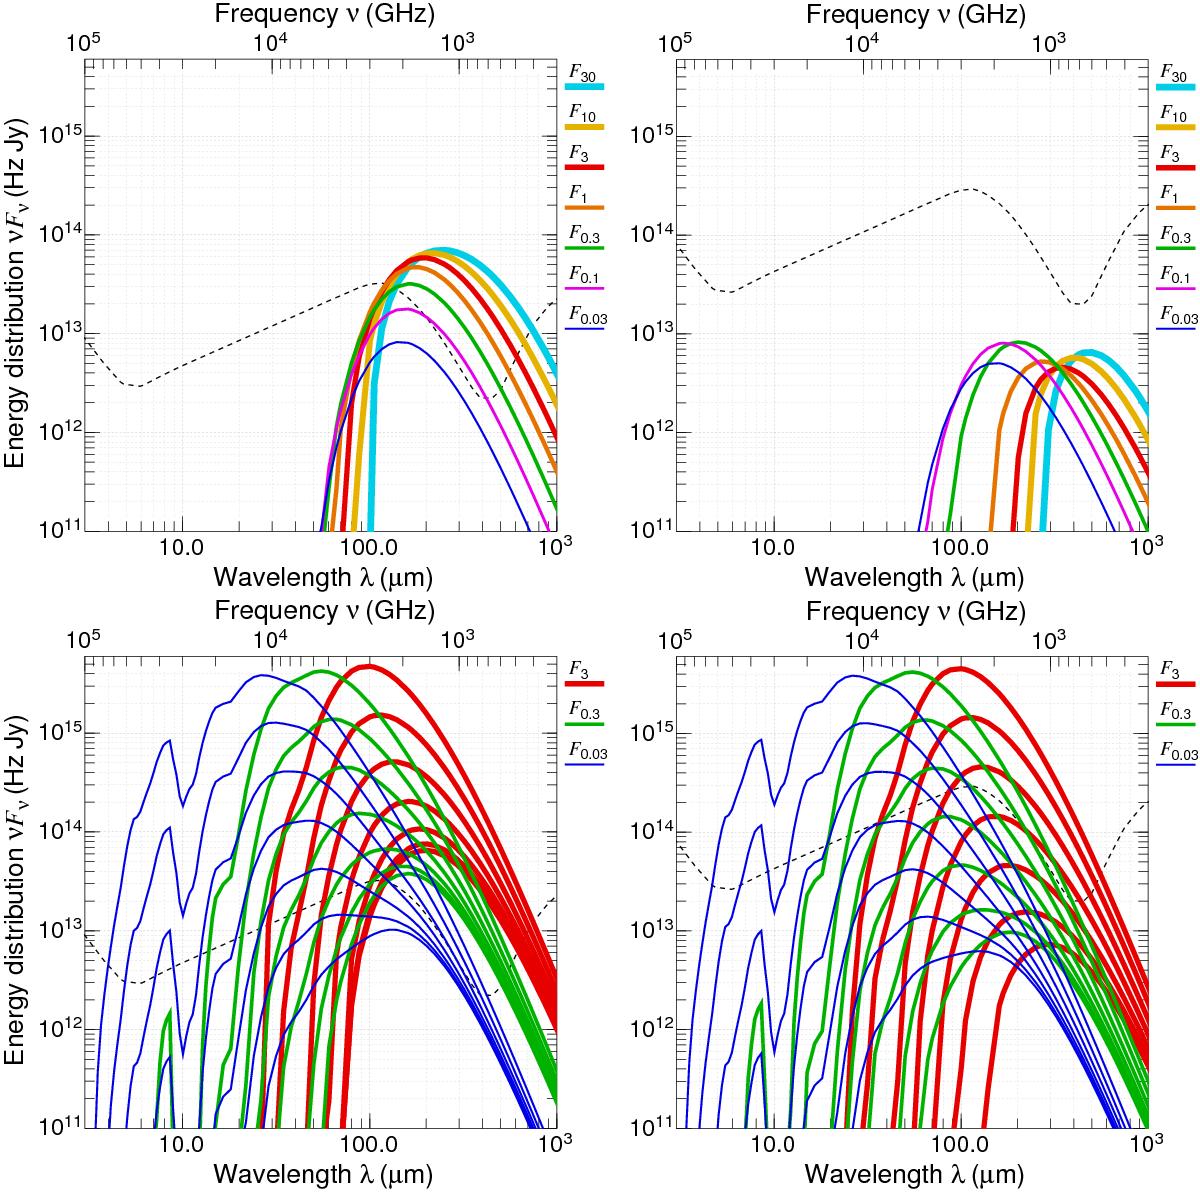
Spectral energy distributions starless cores (upper) and protostellar envelopes (lower). Shown are the background-subtracted fluxes for the isolated models (left) and their embedded variants (right). Subscripts of the curve labels (F30 to F0.03) indicate the model mass (in M⊙). For protostellar envelopes of the same mass, the SEDs with higher fluxes correspond to higher accretion luminosities L⋆ (0.03, 0.1, 0.3, 1, 3, 10, 30 L⊙). Dashed lines indicate the fluxes of the ISRF that were integrated over the projected area of either the isolated models or the embedding clouds.
Current usage metrics show cumulative count of Article Views (full-text article views including HTML views, PDF and ePub downloads, according to the available data) and Abstracts Views on Vision4Press platform.
Data correspond to usage on the plateform after 2015. The current usage metrics is available 48-96 hours after online publication and is updated daily on week days.
Initial download of the metrics may take a while.