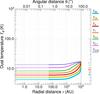
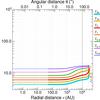
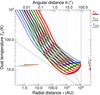
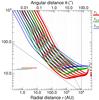
Fig. 3

Radiative-equilibrium dust temperature profiles of starless cores (upper) and protostellar envelopes (lower) for the isolated models (left) and their embedded variants (right). Subscripts of the curve labels (T30 to T0.03) indicate the model mass M (in M⊙). The dashed horizontal lines in the upper panels continue the profiles of starless cores within the innermost radial zone. The dashed vertical line shows the outer boundary radius R = 104 AU of all models. The maximum temperature and the inner boundary of the dusty protostellar envelopes are defined by the adopted dust sublimation temperature TS = 103 K. Three dashed horizontal lines in the lower panels indicate the range of radial distances over which the boundaries R0 of the dust-free cavities are located for the model luminosities in the entire range of 0.03 − 30 L⊙ (see Fig. 2). For protostellar envelopes with the same M, the “hotter” profiles correspond to higher L⋆, larger R0 (cf. Eq. (1)), and lower radial optical depths ![]() . Two dashed lines bracketing the profiles of protostellar envelopes indicate the slopes Td(r) ∝ r-0.88 and ∝ r− 1/3, the latter describing the temperatures of a transparent dusty envelope with the adopted grain properties (see also Appendix A). Vertically aligned filled circles indicate the mass-averaged temperature TM for each model, defined by Eq. (4). The slight wiggling of some profiles around their minima reflects the discrete nature of the Monte Carlo radiative transfer method.
. Two dashed lines bracketing the profiles of protostellar envelopes indicate the slopes Td(r) ∝ r-0.88 and ∝ r− 1/3, the latter describing the temperatures of a transparent dusty envelope with the adopted grain properties (see also Appendix A). Vertically aligned filled circles indicate the mass-averaged temperature TM for each model, defined by Eq. (4). The slight wiggling of some profiles around their minima reflects the discrete nature of the Monte Carlo radiative transfer method.
Current usage metrics show cumulative count of Article Views (full-text article views including HTML views, PDF and ePub downloads, according to the available data) and Abstracts Views on Vision4Press platform.
Data correspond to usage on the plateform after 2015. The current usage metrics is available 48-96 hours after online publication and is updated daily on week days.
Initial download of the metrics may take a while.